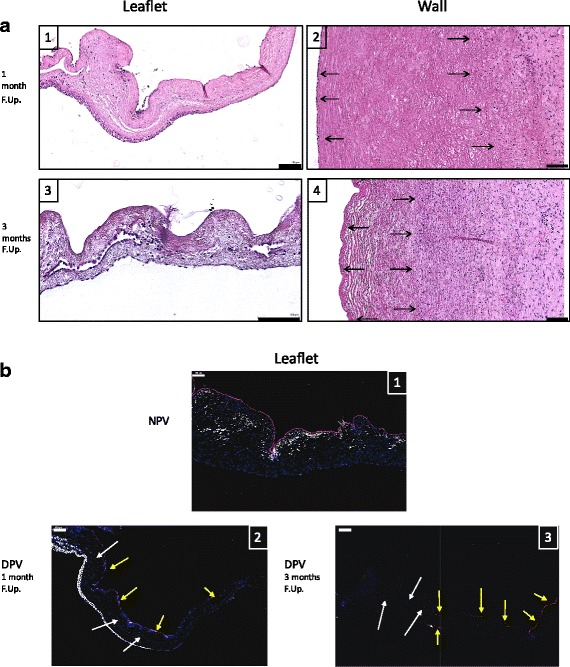
Fig. 6.

In vivo DPV Remodeling. a: Representative histological findings of Hematoxylin and eosin staining of DPV Leaflet (1,3) and Wall (2,4) of at one month (1;2) and three months (3;4) of follow-up illustrating the recellularization process. The black arrows indicate cell nuclei. Scale bar: 100 μm. b: Representative histological findings of CD31 (red) and ASMA (white) IHF stainings counterstained with DAPI (blue) of NPV leaflet (1), DPV leaflet at one month (2) and DPV leaflet at three months (3). Scale bar: 100 μm. The yellow arrows indicate CD31 + cells and white arrows DAPI + cells
