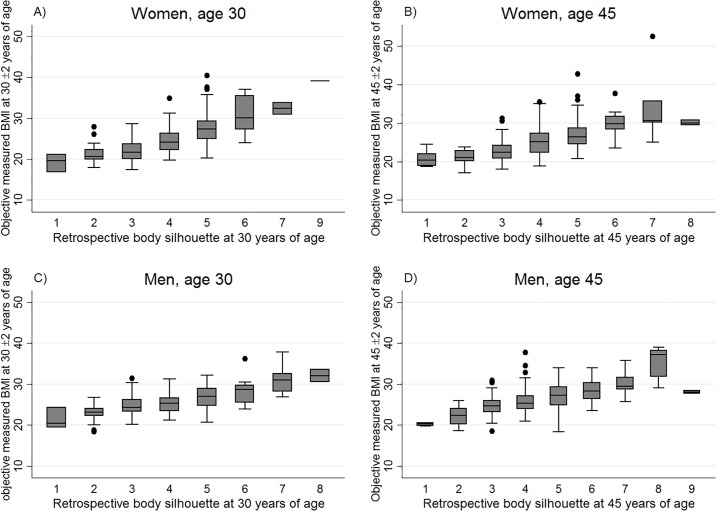
Fig 3.
Box-and-whisker plots showing the distribution of measured BMI by figural scale (reported in ECRHS III), according to sex, in European adults aged 30(±2)years or 45(±2) years in ECRHS II,: A) n 172, BMI range 16.7–40.3; no reporting on figure #8; B) n 296, BMI range 17.0–52.5, no reporting on figure #9; C) n 138, BMI range 18.4–37.9, no reporting on figure #9; D) n 362, BMI range 18.3–39.1. The bottom and top edge of the box represent the first and third quartiles (interquartile range); the line within the box represents the median; the ends of the bottom and top whiskers represent the upper and lower adjacent values; and the dots represent outliers (ECRHS, the European Community Respiratory Health Survey).

