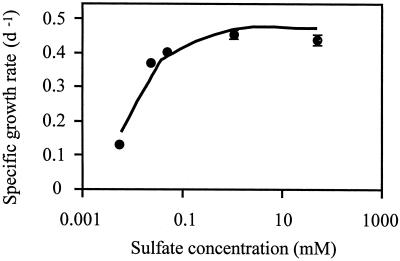
Figure 1.
Specific growth rate of D. salina cells as a function of the sulfate concentration in the growth medium. The error bars show the sd obtained from the analysis of three different cultures. The line represents the growth rate response modeled by the function μ = ([SO42−] × μmax × a)/([a × {SO42−}] + μmax), where μ is the specific growth rate and a is the initial slope of the curve.

