Fig. 10.

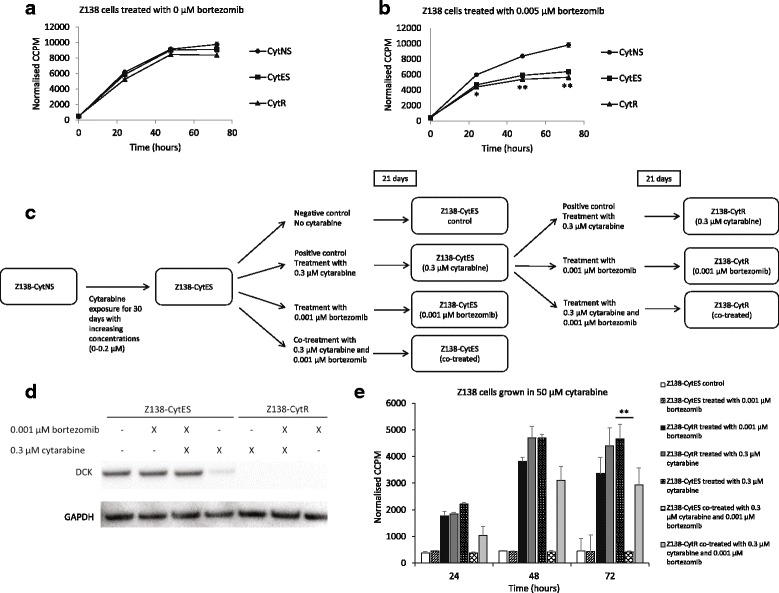
Protein expression of dCK and proliferation of Z138 sub-clones after co-treatment with bortezomib. Growth of cytarabine naive sensitive (Z138-CytNS) cells, cytarabine exposed sensitive (Z138-CytES) cells and cytarabine resistant (Z138-CytR) cells in presence of (a) no drug or (b) 0.005 μM bortezomib after 24–72 h, measured by incorporation of [methyl-14C]-thymidine. Each data point represents a mean value of triplicates ± SEM. * = p < 0.05 and ** = p < 0.01, using students unpaired t-test. According to the established model, Z138-CytES cells develop full resistance against cytarabine after 21 days of exposure to 0.3 μM cytarabine. c Recap of the model from Fig. 1, introducing co-treatment with 0.3 μM cytarabine and 0.001 μM bortezomib, both during resistance development and once resistance have been established. d Western blot analysis of dCK in Z138 sub-clones after 3 weeks of treatment with 0.3 μM cytarabine or co-treatment with 0.3 μM cytarabine and 0.001 μM bortezomib. GAPDH was used as loading control. Representative figure of three biological replicates. e Growth of cytarabine naive sensitive (Z138-CytNS) cells, cytarabine exposed sensitive (Z138-CytES) cells and cytarabine resistant (Z138-CytR) cells in presence of 50 μM cytarabine measured by incorporation of [methyl-14C]-thymidine. Each data point represents a mean value of triplicates ± SEM. * = p < 0.05 and ** = p < 0.01, using students unpaired t-test
