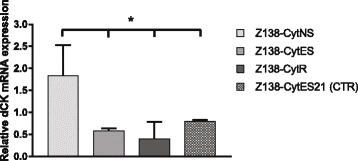
Fig. 3.

Verification of dCK mRNA expression in gene microarray samples. The relative mRNA expression of dCK was assessed in the different Z138 subclones using TaqMan probe based RT-PCR and revealed down-regulation in both Z138-CytES and Z138-CytR cells compared to Z138-CytNS cells. The data are normalised to the S18 reference gene, and the reference sample, replicate A of the Z138-CytNS for each run. Bars represent relative quantity ± SEM of three technical replicates. * = p < 0.05 with statistical significance determined using the Holm-Sidak method, with alpha = 0.05. All significance is compared with Z138-CytNS. Each row was analyzed individually, without assuming a consistent SD
