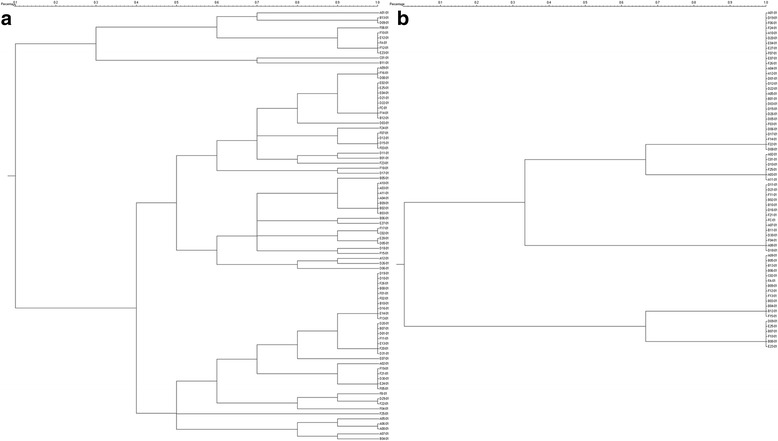
Fig. 5.

Cluster analysis of 86 C. indicum germplasm samples based on two SSR markers. a primer #1; (b) primer #4. The dendrogram shows the genetic similarity between 86 individuals. The scale on the top indicates the number of similar genotypes divided by the total number of genotypes. No PCR amplification signals or suspected signals were excluded
