
Fig 1. Root length and meristem size of the barley cv. Morex upon cytokinin treatment for 10 days.
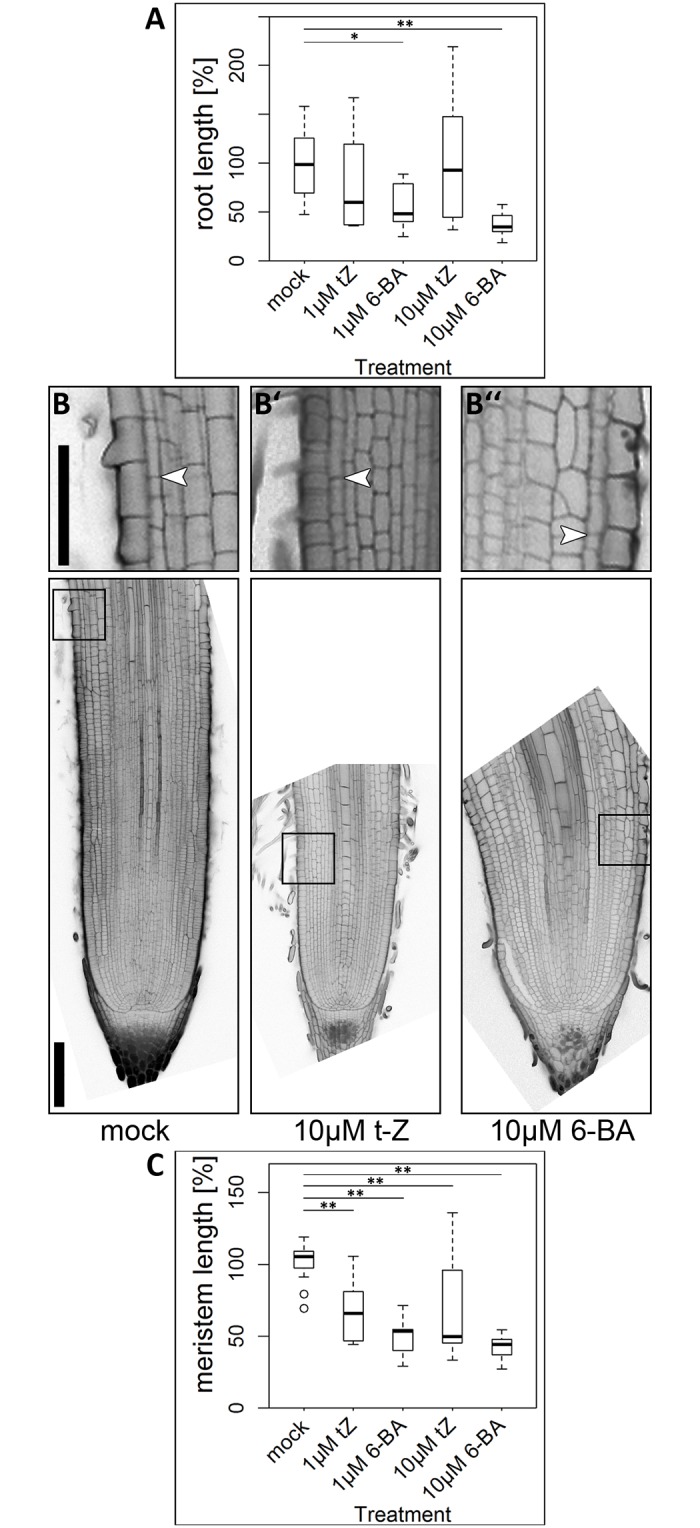
(A) Root length after 10 day-treatment with cytokinin; experiment was performed twice; values normalized to mock-treated plants; n = 7–18 plants per data point. (B)-(B”) Representative pictures of meristem phenotypes upon cytokinin treatment according to the captions; arrowheads mark the transition zones in the outer cortex layer; insets show magnifications of the transition zones; scale bars 200 μm (overviews) and 100 μm (magnified insets). (C) Meristem size after 10-day cytokinin treatment, measured by meristem length; experiment was performed twice; n = 11–16 roots per data point; significance was determined using the two-tailed Student’s t test, * = p<0.05, ** = p<0.001.