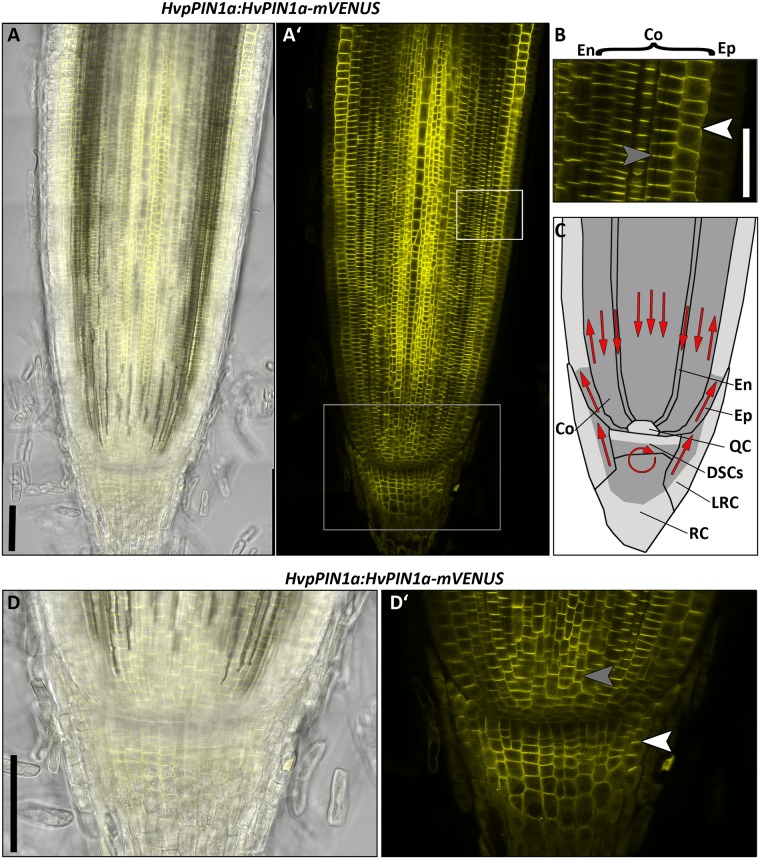
Fig 6. HvPIN1a expression in the root meristem of the barley cv. Golden Promise 8 DAG.
(A) Representative picture of HvpPIN1a:HvPIN1a-mVENUS expression; transmitted light and mVENUS emission (A)), mVENUS emission only (A’)); six independent transgenic lines were examined which vary only in expression level but not in localisation or pattern; white box in A’) marks magnification in B); gray box in A’) marks magnification in D). (B) Magnification of the epidermal, cortical and endodermal cell layers depicted with white frame in A’). (C) Schematic illustration of HvPIN1a expression in the root meristem, high = dark gray, low = gray; red arrows indicate possible auxin flow created by localisation of PIN1 auxin transporters; En = endodermis, Co = cortex, Ep = epidermis, LRC = lateral root cap, RC = root cap. (D) Magnification of the stem cell niche depicted with gray frame in A’); transmitted light and mVENUS emission (D)), mVENUS emission only (D’)); white arrow heads mark apically localised PIN1, gray arrow heads mark basally localised PIN1; scale bars 100 μm in A), D); 50 μm in B).

