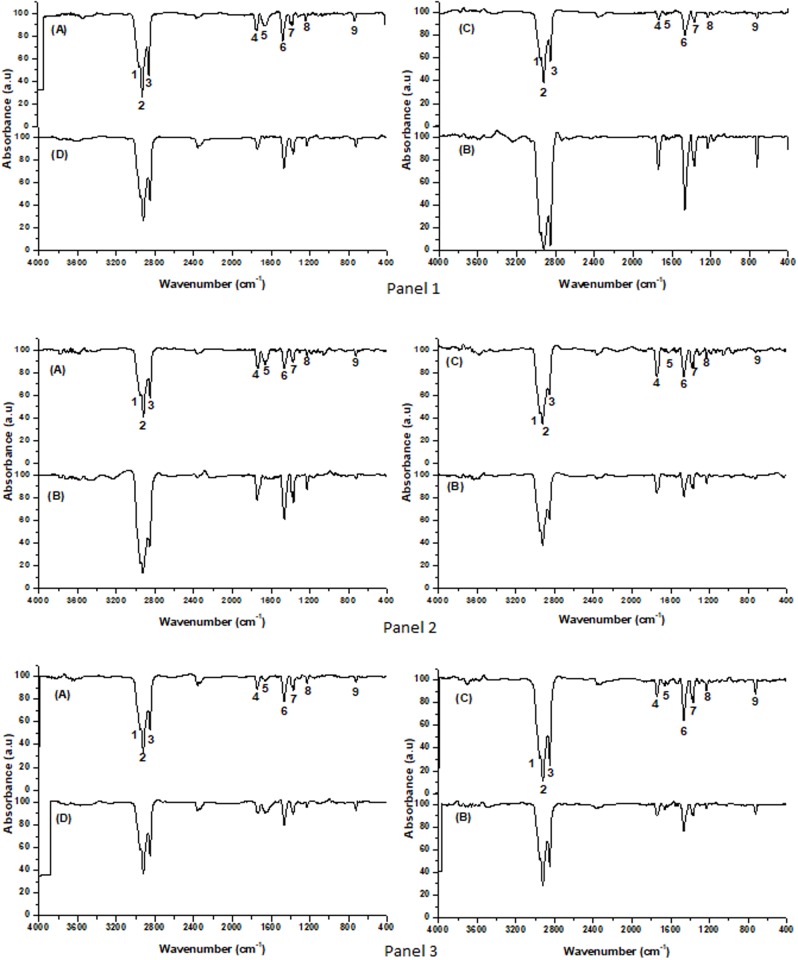
Fig 7. Infrared spectrum profile of the lipid extract obtained after incubation on MM (Panel 1); MMM (Panel 2) and MMC (Panel 3) of B. megaterium CCT 7729, (A) 3 h, (B) 14 h and B. megaterium CCT 7730, (C) 3 h (D) 14 h (FTIR analysis with scans from 4,000 cm-1 to 400 cm-1).
Bands 1 e 2 correspond to (CH2); 3 to (CH3); 4 to (C = O); 5 to (-C = C); 6 to (CH2); 7 to (CH3); 8 to (C-O) and to 9 (CH).

