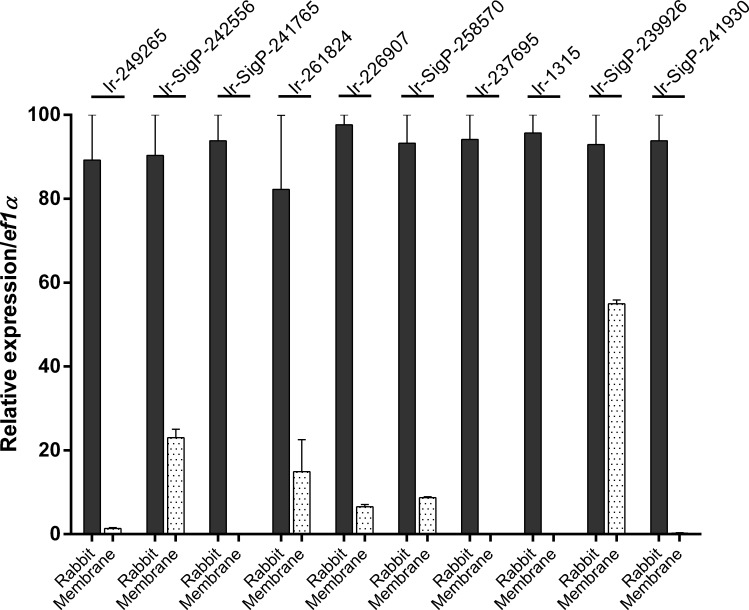
Fig 6. RT-qPCR analyses of differentially expressed transcripts in the tick SG dissected from I. ricinus females at 24 h.
The melting curve analysis was verified and data were normalised to elongation factor 1 (ef1α). Mean and SEM are shown, n = 3 (biological replicates). For annotation of the transcripts, see the Table 1 or the Source data 1 spreadsheet at http://exon.niaid.nih.gov/transcriptome/Ixric-18/S1-web.xlsx.

