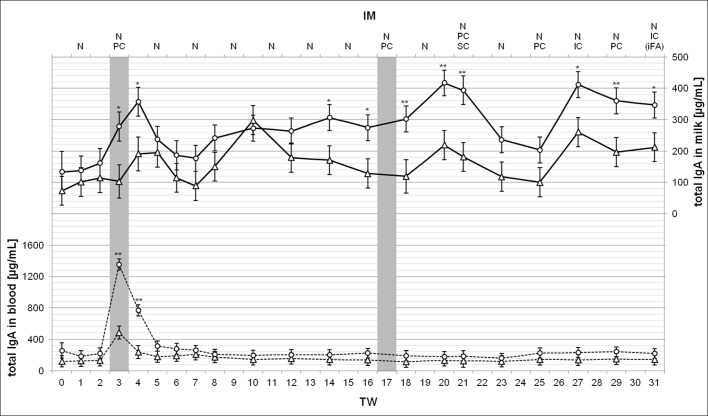
Fig 4. Total IgA concentrations in milk and in blood during 31-weeks treatment period.
Measured total IgA values in milk (solid lines, top) and in blood (broken lines, bottom) are shown as LSM ± SD per treated groups, the low responder (LR, n = 4, triangles) and the high responder (HR, n = 5, circles), on the ordinate. Substantial or highly significant differences between both groups compared to the same point in time are marked by one (P < 0.05) or two asterisks (P < 0.01). The gray bars indicate the one-time application of MucoCD-I vaccine batch A in TW 3 and the first use of vaccine batch B for injection in TW 17. The vaccination routes were nasal (N), PC, SC and IC. The injected MucoCD-I vaccine was uniquely supplemented with iFA.

