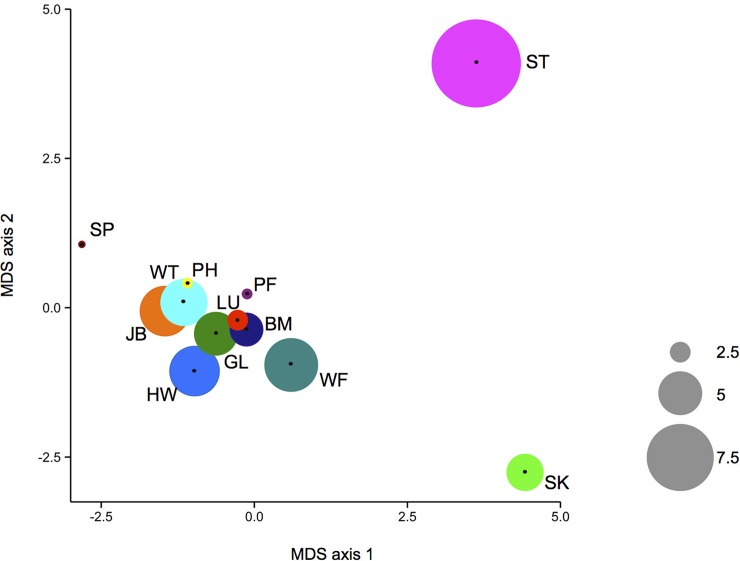
Fig 2. Mice vary in their immunological distance.
The immunological distance among mice (i) within each sample site is shown as the size of the coloured circles, and the immune distance among sites is shown as the 2-dimensional immunological distance following multidimensional scaling (MDS). Within sample site and among sample sites are therefore shown on different scales. Sample sites are colour coded, and 2-letter designations are as shown in Fig 1.

