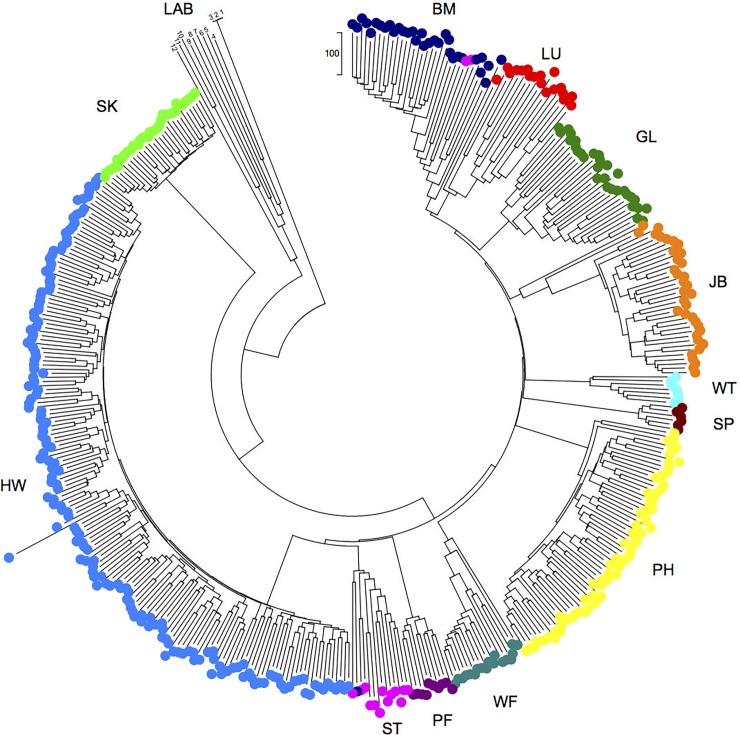
Fig 3. Mice have strongly genetically structured populations.
A neighbour-joining tree showing the relationship among mice. The site colour coding and 2-letter site designations are as Fig 1. The scale is the number of nucleotide differences among individuals. Mice numbers 1–12 are control laboratory mice (LAB), where 1 and 2 are L88 and L90 C57BL/6 mice as in [1], 3 is C57/BL6J, 4 is SJL/J, 5 is FVB/NJ, 6 is NOD/LJ, 7 is BALB/cJ, 8 is AKR/J, 9 is DBA/J, 10 is C3H/HeJ, 11 is CBA/J, and 12 is 129S1/SvlmJ and where 3–12, inclusive, are data obtained from http://support.illumina.com/array/array_kits/mouse_md_linkage/downloads.html.

