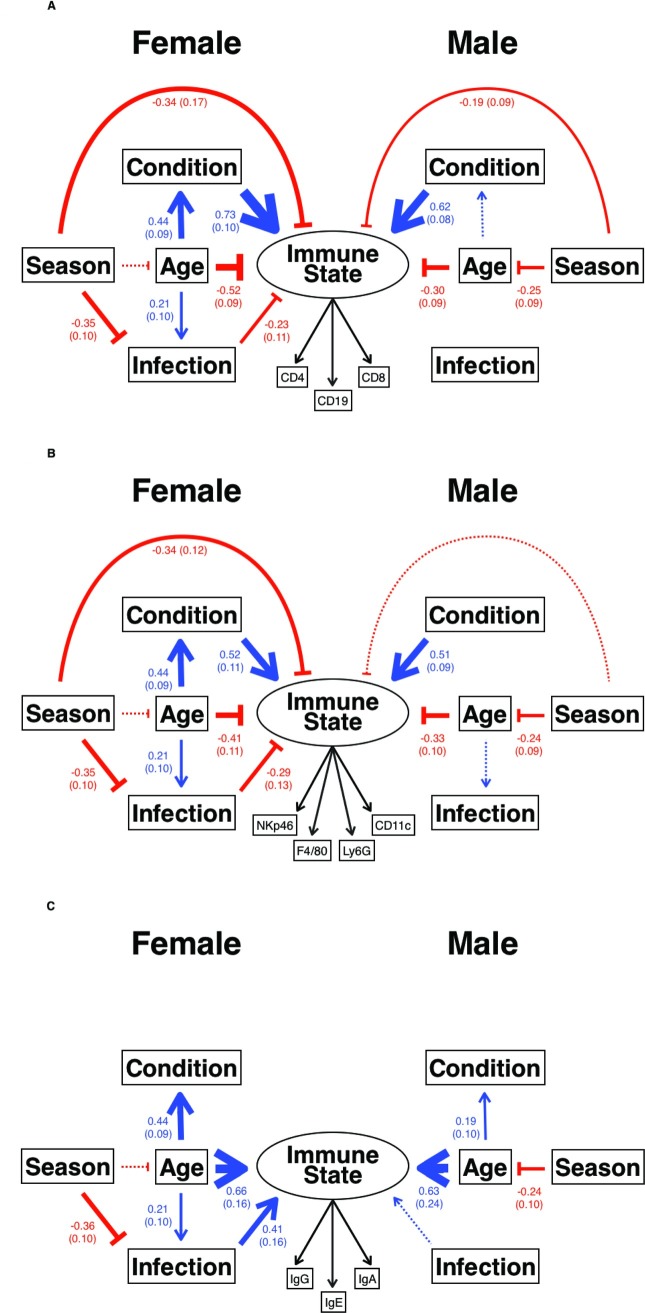
Fig 5. The principal drivers of immune state in wild mice.
How (A) adaptive cellular, (B) innate cellular, and (C) adaptive humoral Immune State are affected by Season (measured as day length), Body Condition (measured as the scaled mass index), Age in weeks, and Infection with up to 7 microbial infections, with latent variables shown as circles and observed variables shown as boxes, and where blue arrows show positive effects, red blunt-ended lines show negative effects, and line thickness indicates the size of the covariance, which is shown (with the SE in parentheses) for mice from site HW; marginally nonsignificant results are shown by thin dotted lines. All estimates, SE, and p-values are shown in S7 Table. In (A), for females root mean square error of approximation (RMSEA) = 0.0 (0.0–0.126), comparative fit index (CFI) = 1.0, standardized root mean square residual (SRMR) = 0.03, χ2 = 7.64, df = 8, p = 0.469, for males RMSEA = 0.058 (0.0–0.139), CFI = 0.987, SRMR = 0.031, χ2 = 10.65, df = 8, p = 0.22; (B) for females RMSEA = 0.0 (0.0–0.08), CFI = 1.0, SRMR = 0.045, χ2 = 10.39, df = 14, p = 0.732, for males RMSEA = 0.137 (0.089–0.188), CFI = 0.891, SRMR = 0.082, χ2 = 40.46, df = 14, p = 0.0002, which is not a significantly good fit; (C) for females RMSEA = 0.093 (0.0–0.176), CFI = 0.926, SRMR = 0.09, χ2 = 13.64, df = 8, p = 0.0917, with warnings concerning the latent variable Immune State, for males RMSEA = 0.0 (0.0–0.093), CFI = 1.0, SRMR = 0.058, χ2 = 5.74, df = 8, p = 0.675.

