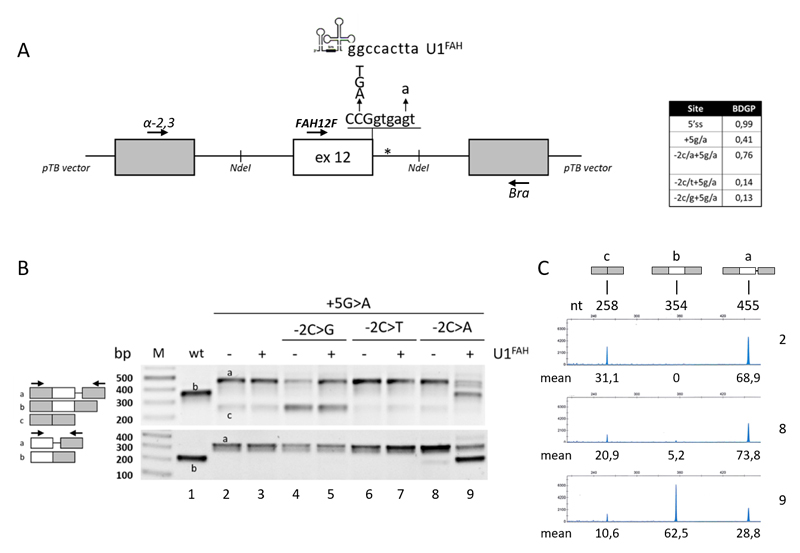
Figure 1. Splicing patterns of FAH minigenes in HepG2.
A) Schematic representation of the FAH minigene, cloned within the NdeI sites (indicated) in the pTB vector, with the sequence of the exon 12 5’ss and of the investigated changes as well as of the 5’ tail of the compensatory U1FAH. The asterisk indicates the crypric 5’ss.
The table reports the predicted score of the wild type or mutated 5’ss (http://www.fruitfly.org/seq_tools/splice.html).
B) FAH splicing patterns in HepG2 cells transiently transfected with pFAH minigenes (1 μg) alone or with a molar excess (1.5X) of pU1FAH. RT-PCR was conducted with primers α-2,3 and Bra (upper panel) or primers FAH12F and Bra (lower panel), and amplicons were separated on 2% agarose gel. The scheme of amplicons is reported on the left together with primers used (arrows).
C) FAH splicing patterns as in the upper panel of section B (lanes 2, 8 and 9) evaluated by fluorescently-labelled RT-PCR with primers α-2,3 and BraFAM, followed by denaturing capillary electrophoresis. The scheme of amplicons and the length (nt) are reported on top. Numbers below peaks indicate the relative amount (%, mean from three independent experiments) of each transcript.

