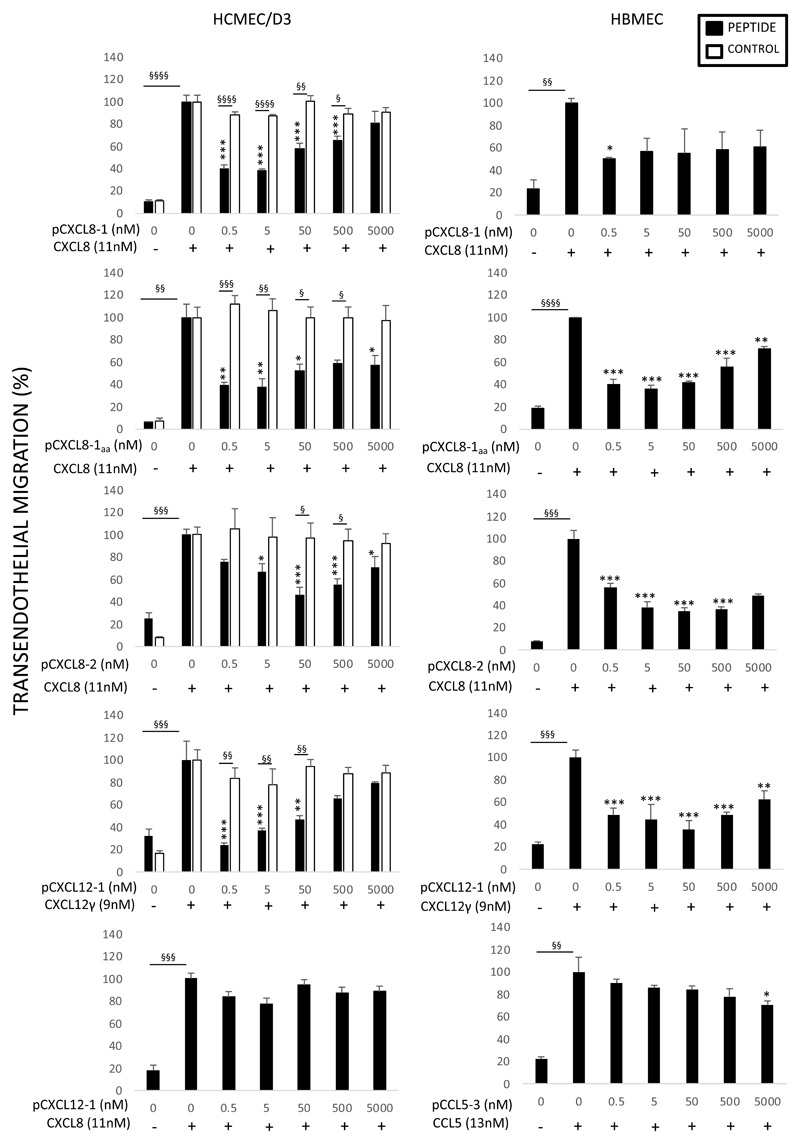
Figure 4. Anti-chemotactic effects of peptides on leukocyte transendothelial migration.
Anti-chemotactic ability of peptides was tested in HBMEC and HCMEC/D3 cell lines. On the y axis percentage of transendothelial migration in response to increasing concentration of peptide (nM) on the x axis. Indicated (±) is the presence of 100 ng/ml chemokine. The effect of the peptide (black) is compared to a control peptide (white). For CXCL8 and CXCL12γ peptides neutrophils were used and mononuclear cells for the CCL5 peptide. Data shown are mean transendothelial migration ± SE (n=3). *p<0.05, **p<0.01, ***p<0.001 compared to chemokine alone in absence of peptide, §p<0.05, §§p<0.01, §§§p<0.001, §§§§p<0.0001. Percentage migration was calculated from the total number of cells added.

