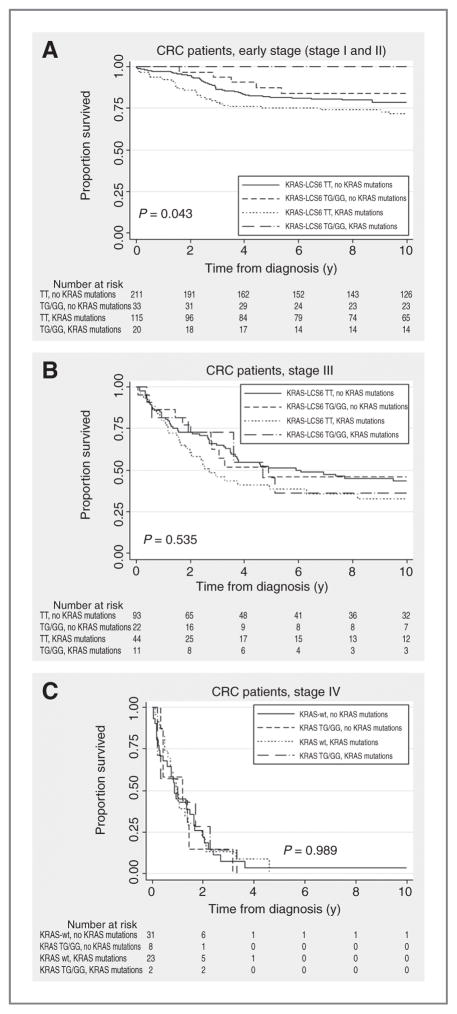
Figure 2.
A, Kaplan–Meier curve for the KRAS-LCS6 variant, KRAS mutations and cause-specific survival in early-stage (stage I and II) CRC, P = 0.875. B, Kaplan–Meier curve for the KRAS-LCS6 variant, KRAS mutations and cause-specific survival in stage III CRC. C, Kaplan–Meier curve for the KRAS-LCS6 variant, KRAS mutations and cause-specific survival in stage IV CRC.

