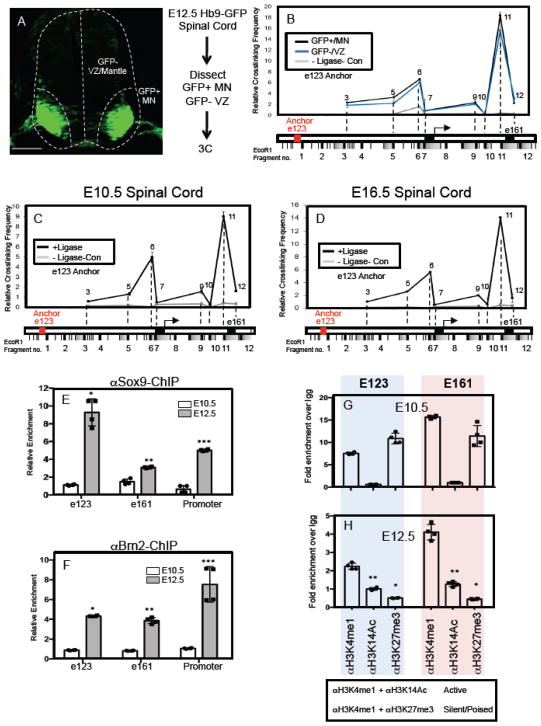
Figure 4. Gliogenic chromatin loop forms prior to NFIA induction.
(A) GFP expression in MN populations in the E12.5 spinal cord of the Hb9-GFP mouse and the associated workflow for 3C experiments in GFP-positive MN populations and GFP-negative VZ/mantle populations. (B) Chromatin conformation capture (3C) assay performed on E12.5 spinal cord from Hb9-GFP mice, where the GFP+/MN and GFP-/VZ regions were manually dissected. Red text denotes e123 as the anchor point from which long-range DNA interactions across the e123 – e161 interval were measured. (C–D) Chromatin conformation capture (3C) assay performed on E10.5 (C) and E16.5 (D) spinal cord from wild type mice. Red text denotes e123 as the anchor point from which long-range DNA interactions across the e123 – e161 interval were measured. For each 3C experiment (B–D), three independent libraries were assayed per experiment. Note that in each 3C experiment a no ligase control was performed to assess the level of ligase-independent non-specific PCR products. (E–F) Chromatin immunoprecipitation assay (ChIP) assays on E10.5 and E12.5 spinal cord, comparing the relative enrichment of Sox9 (E) and Brn2 (F) associations with e123, e161, and the core promoter. (G–H) ChIP assays from spinal cord comparing the methylation and acetylation status of the E123 and E161 enhancers before (E10.5) and during the gliogenic switch (E12.5). Blue shaded panels represent data from e123 at both E10.5 and E12.5, while the pink shaded panels represent data from e161 at both E10.5 and E12.5. Statistics: (E) *p=0.03, **p=0.04, and ***0.007. In (F) *p=9x10⁻⁵, **p=0.004, ***p=0.05. In (H) *p= 0.01, **p=0.04. All error bars are SD. Scale bars are 100um.

