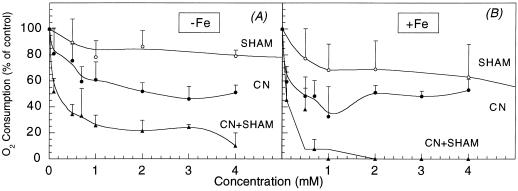
Figure 3.
Changes in O2 consumption rates in yellow, iron-deficient (A) and iron-sufficient root tips (B) with different concentrations of SHAM (○), CN− (●), and CN− + SHAM (▴). Data are means ± se of three different replications. Actual O2 consumption rates are shown in Table V.

