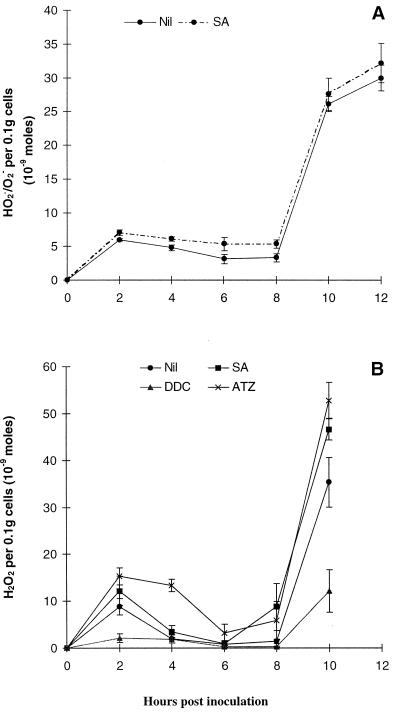
Figure 4.
The effect of inhibitors of endogenous CAT and SOD on ROS production during the incompatible interaction. The effect of 1 mm SA on HO2./O2− (A) and H2O2 (B) production and of 1 mm ATZ and 1 mm DDC on H2O2 production (B) was monitored. Data represent means ± se of n = 9 from two experiments for SA data and n = 6 from two experiments for ATZ and DDC results.

