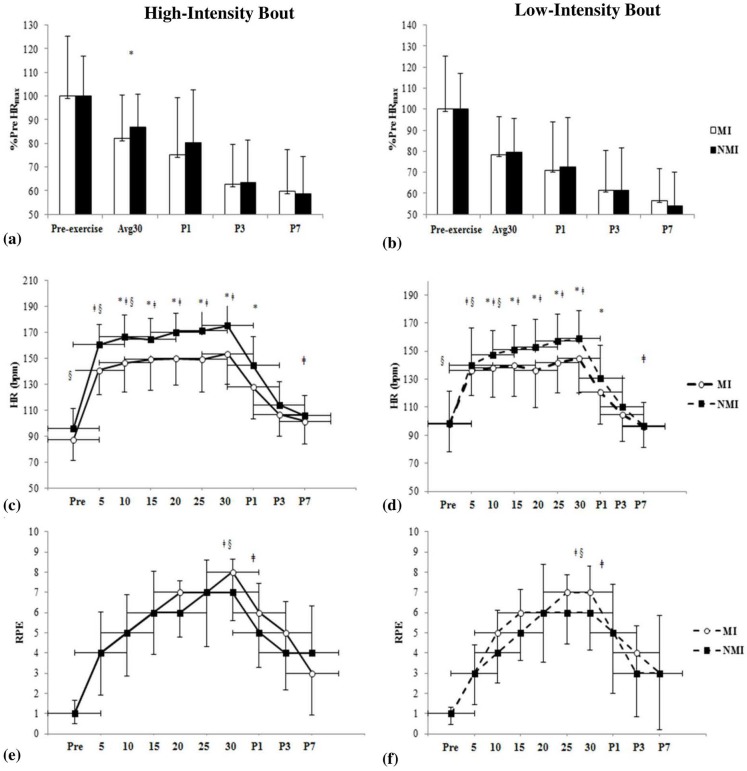
Fig 3. Cardiovascular and perceptual responses for high- and low-intensity bouts.
Percent change from baseline heart rate maximum (HRmax) during cycling bout and post-1, 3 and 7 min (P1, P3, P7) presented for high-intensity visit (HI) (a) and low-intensity visit (LI) (b). MI group (Hollow bars) and NMI group (filled bars). Figs (c) and (e) illustrate the change in HR and ratings of perceived exertion (RPE) pre, during and post-HI-cycling (solid line). Measures were recorded every 5 min throughout the cycling and following in recovery at P1, P3and P7. Figs (d) and (f) represent HR and RPE during the LI-cycling bout (dotted line). Vertical and horizontal error bars represent standard deviation (SD). *p≤0.05 vs. NMI (group); ǂp≤0.05 for Intensity; §p ≤0.05 vs. NMI at same time point (Group x Intensity).

