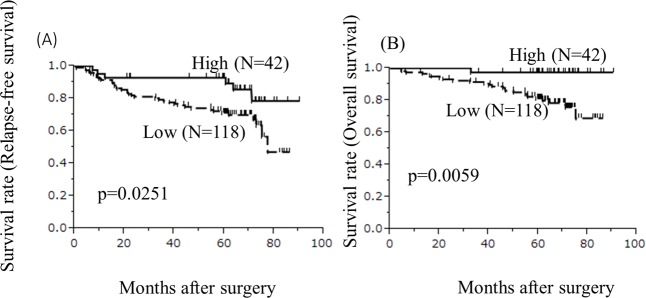
Fig 4. Survival curves.
(A)The survival curves for relapse-free survival. The relapse-free survival rates of the low-TIL group were significantly worse in comparison to the high-TIL group (p = 0.0251). (B)The survival curves for overall survival. The overall survival rates in the low-TIL group were significantly worse in comparison to the high-TIL group (p = 0.0059).

