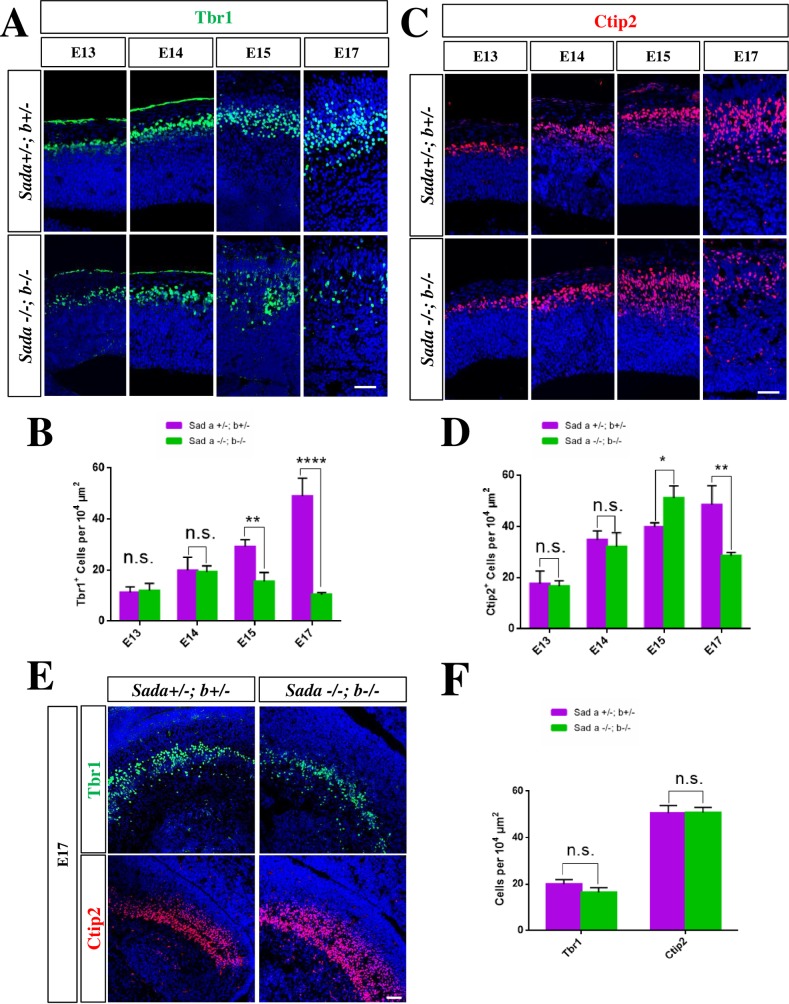
Fig 2. A loss of neurons in the Sada-/-;Sadb-/- cortex is first observed at E15.
(A, C, E) Coronal sections from the brains of E13 to E17 embryos with the indicated genotype were stained with antibodies for Tbr1+ (marker for L5/6 and subplate; green) or Ctip2+ (L4–6; red) and Hoechst 33342 (blue). (B, D, F) The number of Tbr1+ (B, F) and Ctip2+ cells (D, F) in the cortex (B, D) and hippocampus (F, E17) normalized to an area of 104 μm2 is shown for the Sada+/-;Sadb+/- (magenta) and Sada-/-;Sadb-/- cortex (green). Values are means ± s.e.m., n = 3 different embryos, two-way ANOVA compared to heterozygous control; *, p<0.05; **, p<0.01, ***, p<0.001. The scale bars are 50 μm.

