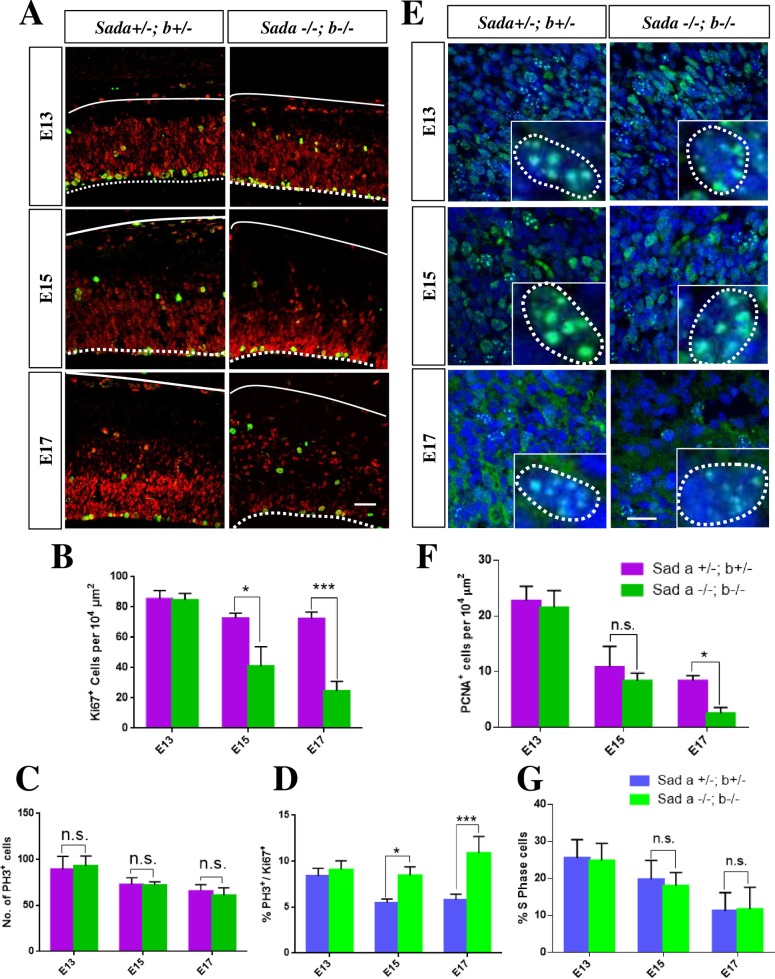
Fig 4. The loss of Sad kinases leads to an increase in the mitotic index.
(A, E) Coronal sections from the brains of E13, E15 or E17 embryos with the indicated genotypes were analyzed by staining with anti-Ki67 (A, proliferating cells, red) and anti-PH3 antibodies (A, cells in M-phase, green) or with an anti-PCNA antibody (E, green) and Hoechst 33342 (blue). (B—D) A significant decrease in the number of proliferating Ki67+ cells per 104 μm2 (B) was observed at E15 and E17 when comparing the Sada+/-;Sadb+/- (magenta (B, C) and blue (D), respectively) and Sada-/-;Sadb-/- cortex (green). The number of mitotic PH3+ cells per section remained constant (C) but the mitotic index (D, ratio of PH3+ and Ki67+cells in %) increased in the Sada-/-;Sadb-/- cortex (green) at E15 and E17 compared to Sada+/-;Sadb+/-controls since the number of Ki67+cells was reduced. (F—G) The number of PCNA+ cells in S-phase (PCNA+ cells with a punctate staining pattern (inset)) per 104 μm2 (F) and the proportion of cells in S-phase (G, ratio of PCNA+ S-phase and Ki67+cells in %) in the VZ/SVZ of the cortex were quantified in the Sada-/-;Sadb-/- cortex (green) and Sada+/-;Sadb+/-controls (magenta (F) and blue (G), respectively). Values are means ± s.e.m., n = 3 different embryos, two-way ANOVA compared to heterozygous control; *, p<0.05; **, p<0.01; ***, p<0.001, n. s., not significant). The Scale bars are 20 μm.

