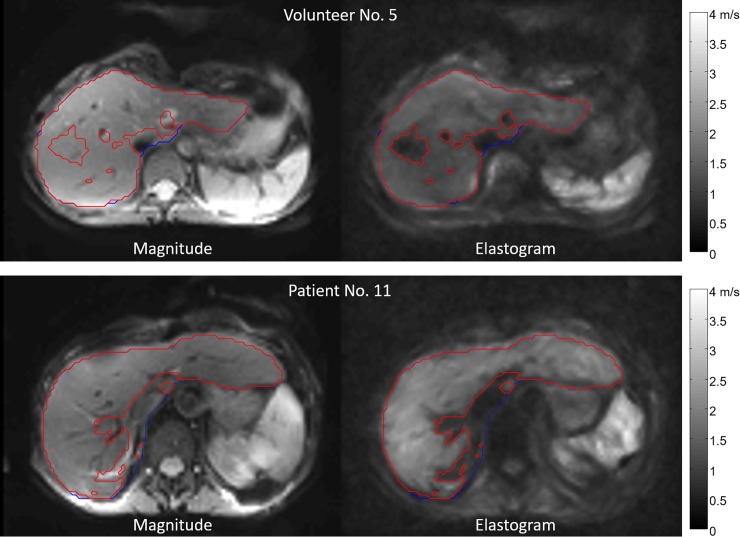
Fig 1. MRE.
Axial magnitude image of the liver and corresponding elastogram. ROI for the segmentation of the liver contour (blue) and ROI with a cutoff of 1 m/s (red). Upper row: Healthy volunteer No. 5 with an average SWS of 1.30 ± 0.17 m/s. Bottom row: Patient No. 11. The brighter color in the elastogram indicates an increased SWS of 1.72 ± 0.30 m/s.

