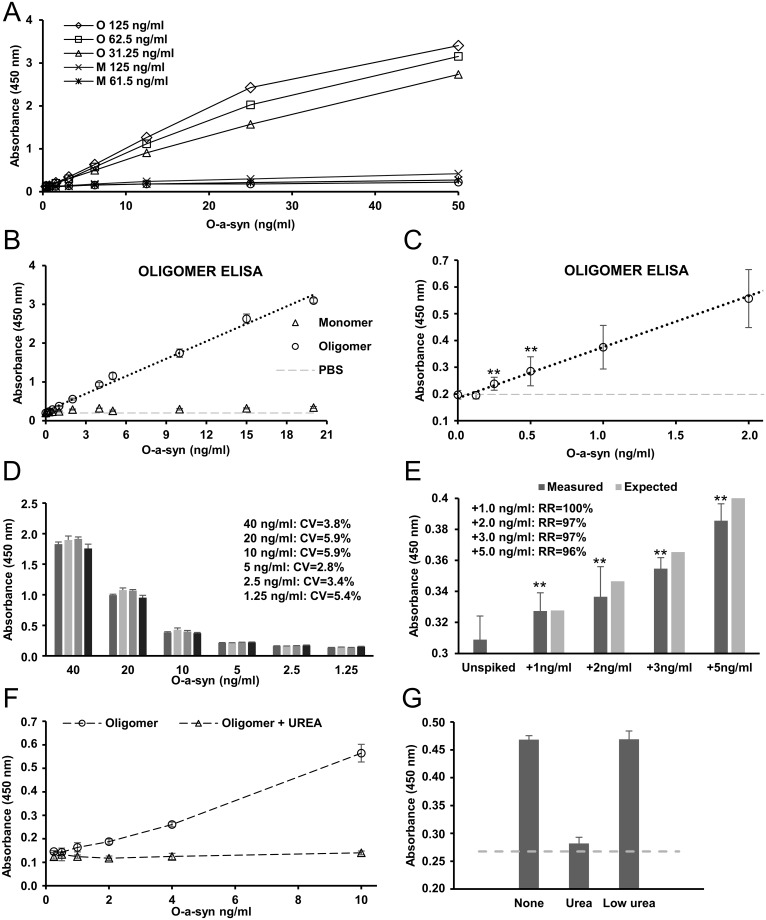
Fig 2. A-syn oligomer ELISA sensitivity and specificity.
A. Test of three different concentrations (0.125, 0.0625, and 0.03125 μg/ml) of capture antibody MJF14-6-4-2 (MJF) for monomeric and oligomeric a-syn for the oligomer ELISA. 0.0625 μg/ml is chosen as the optimal concentration for MJF14-6-4-2 based on sensitivity and specificity from monomeric a-syn. B. The oligomer ELISA detects oligomeric a-syn in a linear range from 0.25–20 ng/ml oligomer a-syn with the use of MJF14-6-4-2 as capture antibody and the anti-a-syn (BD) as detection antibody (R2 = 0.99). Monomeric a-syn is not detected by the oligomer ELISA in this range. Negative control (PBS) shown in light grey. C. The graph from C. zoomed in on the lower part of the X-axis. The oligomer ELISA detects down to 0.25 ng/ml oligomeric a-syn (P = 0.001). D. Determination of inter-assay coefficient of variation (CV). Comparison of results from four different runs is used to determine CV for the oligomer ELISA. CV is calculated for 6 different concentrations of oligomers (1.25 ng/ml– 40 ng/ml) resulting in 6 different CVs values all below 6%—in average 4,5%. E. Recovery by recombinant a-syn oligomers spiked into WT mouse brain synaptosomes. Mouse brain synaptosomes are spiked with different amounts of oligomers (1, 2, 3, and 5 ng/ml). Expected increase in absorbance is calculated from an internal series of controls, and the recovery rate is calculated for each concentration of spiked amount of oligomer. All recovery rates are above 95%—in average 98%. Data are an average of 4 different experiments run in triplicates. Data are compared to unspiked for significance. F. Validation that a-syn oligomer signal is caused by conformational epitopes. Treatment with 8M urea inhibits the a-syn oligomer signal on the oligomer ELISA. Higher concentrated oligomers are treated for 3 hours with 8M urea, and then diluted to 3mM urea before addition to the ELISA. G. To validate that the urea treatment does not affect the binding capability of the ELISA or/and the antibodies used, the experiment was run with longer incubation time, an oligomer concentration of 2.5 ng/ml, and low amounts of urea equivalent to the amount of UREA present in the urea treated oligomers after dilution (urea concentration during running conditions = 3 mM). 8M urea treatment reduces the oligomer signal, whereas 3mM urea treatment does not remove the oligomer signal. “None” represents non-treated a-syn oligomers, whereas background signal from PBS without a-syn is shown by the dotted grey line. Both G. and H. show one representative experiment of 3. Standard deviations represent three technical replicates. Significance for all parts of figure is marked with an asterisk: *p<0.05; **p<0.005. Results were compared using one-way ANOVA followed by Turkey’s post hoc test for multiple comparison.

