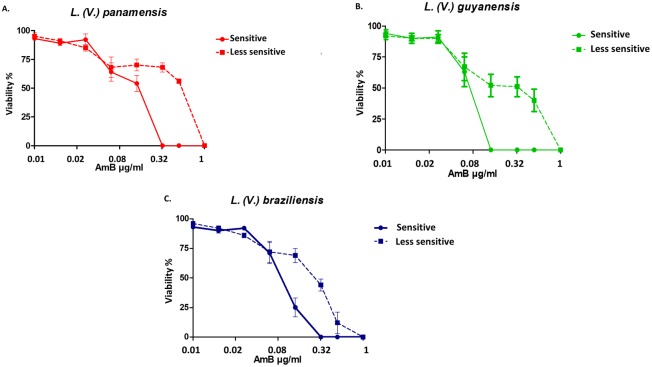
Fig 1. Percentage of viability of promastigotes to different concentrations of AmB.
Promastigotes of the reference strain for each species were selected by gradually increasing the AmB concentration. The dotted line graphs indicate the less sensitive promastigotes. The y-axis shows the percentage of viability, and the different AmB concentrations used are shown on the x-axis. The experiments were performed in triplicate.

