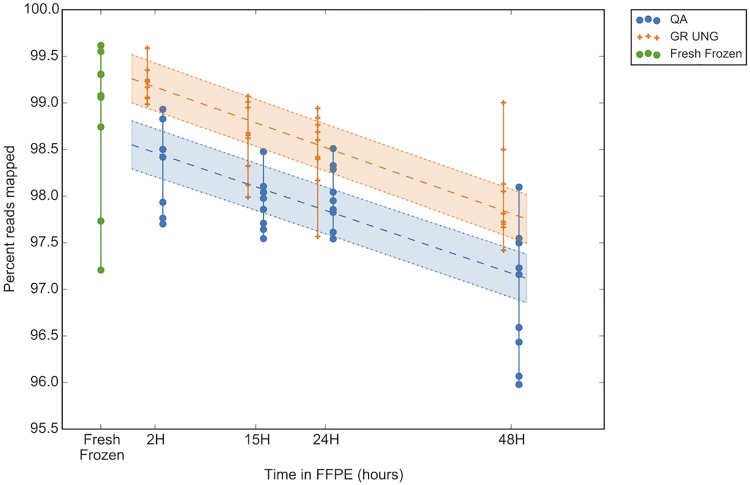
Fig 5. Sequencing read quality decreases over fixation time.
Read quality as a measure of percent reads mapped (y-axis) decreases with a longer tissue fixation time (x-axis). Blue dots represent DNA without UNG treatment (extracted using QiaAmp FFPE kit; QA), orange crossed represent matched DNA treated with UNG (extraction using the GeneRead kit; GR UNG). Linear regression line depicted by the central broken line and encompassed by dotted lines representing the 95% confidence interval (CI region colored). Frozen samples used for ground truth are represented by green dots. GR UNG = GeneRead uracil-N-glycosylase, QA = QiaAmp FFPE kit.

