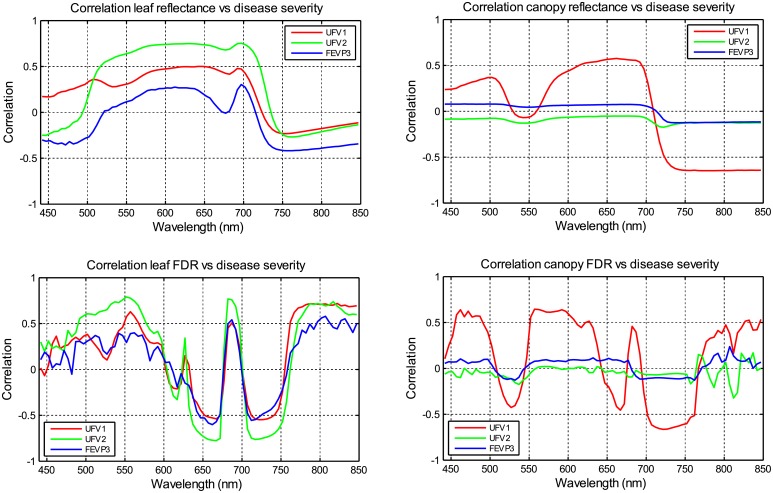
Fig 5. In 440–850 nm, correlation between the reference necrotic disease severity and (a) the leaf reflectance, (b) the canopy reflectance, (c) the leaf FDR, and (d) the canopy FDR.
Each graph represents, for each wavelength, the correlation between the reference necrotic disease severity and either the reflectance or the FDR spectra value at this wavelength, considering the different plots and the different acquisition times.

