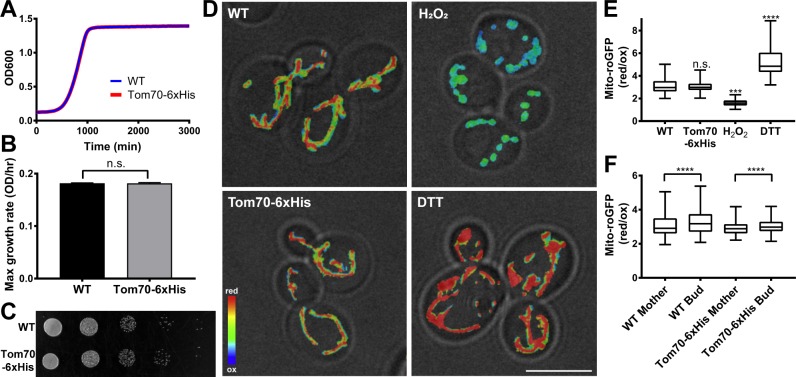
Fig 2. Cellular and mitochondrial fitness are not affected by tagging Tom70 with 6xHis.
(A) The growth rate of yeast expressing untagged or 6xHis-tagged Tom70 was monitored by measuring the optical density of the culture in YPD medium at 600 nm (OD600) every 20 min for 3 days. (B) Maximum growth rate was calculated from the maximum slope of the growth curve in mid-log phase. There was no significant difference in growth rate of yeast expressing untagged or 6xHis-tagged Tom70 (two-tailed t-test). (C) The respiration-driven growth of yeast expressing untagged or 6xHis-tagged Tom70. Yeast were spotted in 10-fold serial dilutions to YPG plates and incubated at 30°C for 5–7 days. (D) Representative images of mito-roGFP1 in wild-type (WT), Tom70-6xHis cells, and cells treated with 5 mM H2O2 or DTT. The ratio of the reduced to oxidized roGFP signals is shown in heat maps superimposed on a transmitted-light image. Warmer colors represent more reducing enviroments and cooler colors represent more oxidizing environments. Scale bar = 5 μm. (E) Quantification of mitochondrial redox state using mito-roGFP. H2O2 and DTT treatments generate highly oxidized and reduced mito-roGFP1, respectively, and illustrate the dynamic range of the sensor. No significant difference was detected between wild-type and Tom70-6xHis cells (Kruskal-Wallis test with Dunn’s multiple comparisons test). Number of cells analyzed: WT = 160; Tom70-6xHis = 139; H2O2 = 173; DTT = 160. (F) Quantification of mitochondrial redox asymmetry between bud and mother cells of wild type and Tom70-6xHis cells. Buds have a more reduced mitochondrial redox state compared to mother cells in both wild-type and Tom70-6xHis cells (Wilcoxon matched-pairs signed rank test, ****p < 0.0001). Number of cells analyzed: WT = 154; Tom70-6xHis = 130.

