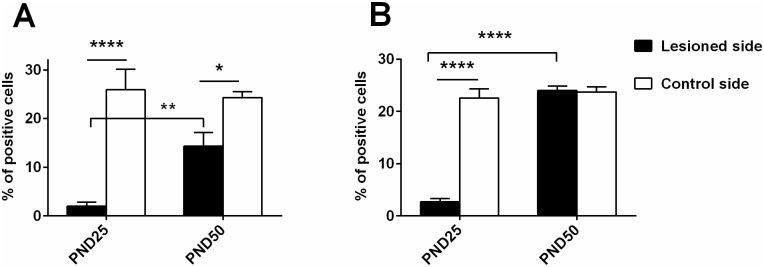
Fig 8. Percentage of DRD1 and DRD2 positive cells in DS.
The number of positive cells for DRD1 RNA and nuclear staining (A) or DRD2 RNA and nuclear staining (B) in the lesioned and in the corresponding area on the control side of PND25 and PND50 rats is reported in percentages of the total number of nuclear staining-positive cells. Significant total difference is indicated as ****p<0.001, **p<0.01, *p<0.05.

