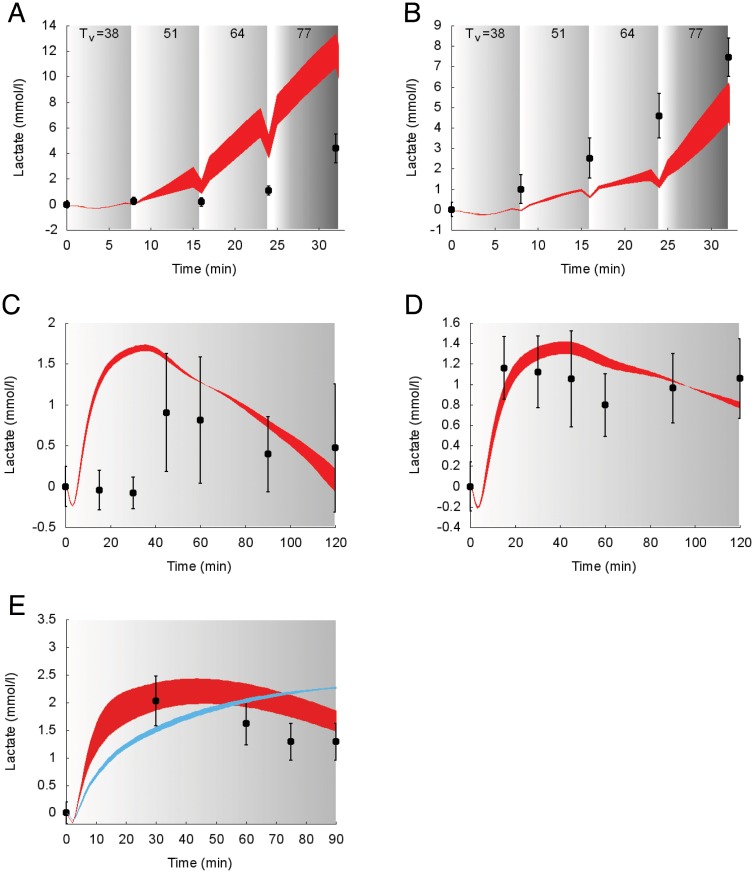
Fig 9. Dynamics of suprabasal plasma lactate concentration in response to exercise.
Model fit (colored areas) vs experimental data (circles) expressed as mean ± SE. The colored areas show the range of the dynamic responses of the model to the variability of the subjects’ characteristics as reported in Table 2 (blue: females; red: males); individual response curves related to each simulation are available. The gray zone refers to the exercise period. The dark gray zone refers to the exercise performed above the LT until minute 32. The colored area shows the dynamic responses of the model to the variability of the subjects’ characteristics as reported in Table 2. A: Trained individuals from the study 1. B: Untrained individuals from the study 1. C: Trained individuals from the study 4. D: Untrained individuals from the study 4. E: Individuals from the study 5.

