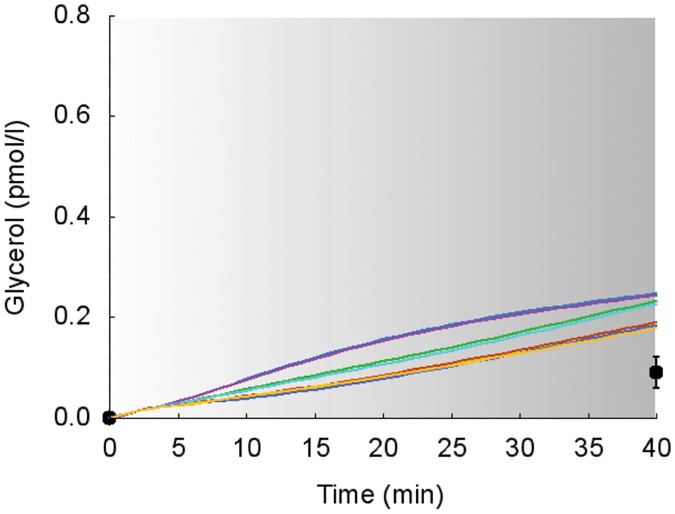
Fig 13. Dynamics of suprabasal plasma glycerol concentration in response to exercise.
Model fit (colored lines) vs experimental data (circles) expressed as mean ± SE. The colored lines show the different simulated dynamic responses of the eight subjects from the study 2 [32]. The gray zone refers to the exercise period.

