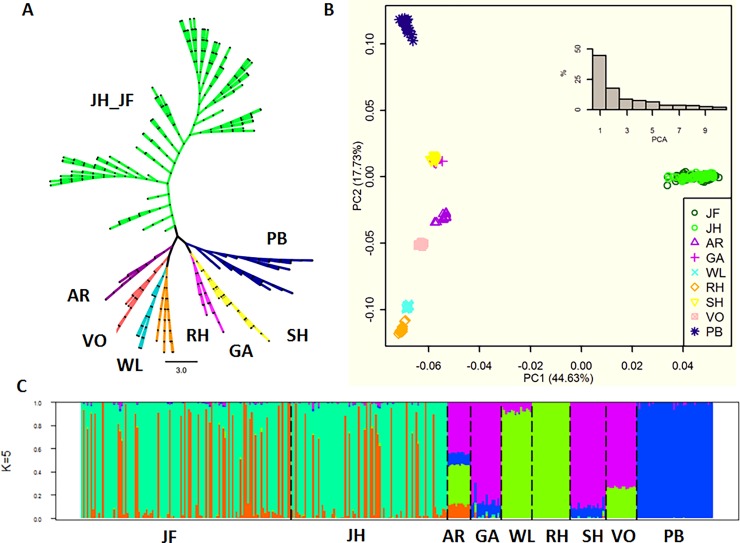
Fig 1. Analysis of the phylogenetic relationship and population structure of 9 chicken breeds.
(A) Neighbor-joining tree constructed using SNP data. (B) Principal component analysis. (C) Population structure analysis of the 331 chicken individuals, showing the distribution of the K = 5 genetic clusters. See material and method for the abbreviations of the breeds.

