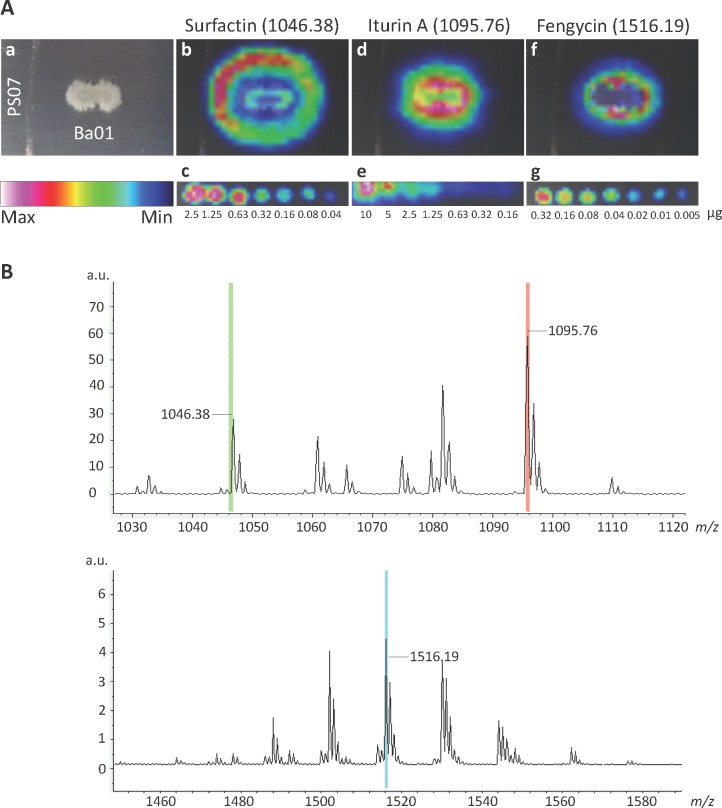
Fig 3. Imaging mass spectrometry of Ba01 against S. scabies PS07.
A. (a) S. scabies PS07 was initially inoculated in a vertical line on a 2% YME solid agar plate. After 12 h, B. amyloliquefaciens Ba01 was inoculated in a horizontal line on the same plate for another 24 h. (b) The IMS image of an ion with m/z 1046.38 represents surfactin. (c) The image represents two-fold serial diluted surfactin as a standard control ranging from 2.5 to 0.04 μg. (d) The IMS image of an ion with m/z 1095.76 represents iturin A. (e) The image represents two-fold serial diluted iturin A as a standard control ranging from 10 to 0.16 μg. (f) The IMS image of an ion with m/z 1516.19 represents fengycin. (g) The image represents two-fold serial diluted fengycin as a standard control ranging from 0.32 to 0.005 μg/mL. Intensity gradients for surfactin, iturin A, and fengycin are normalized and illustrated by color histogram (maximum, white; minimum, black). B. The mass spectra of IMS regions include three major peaks: m/z 1046.38 (surfactin), 1095.76 (iturin A), and 1516.19 (fengycin).

