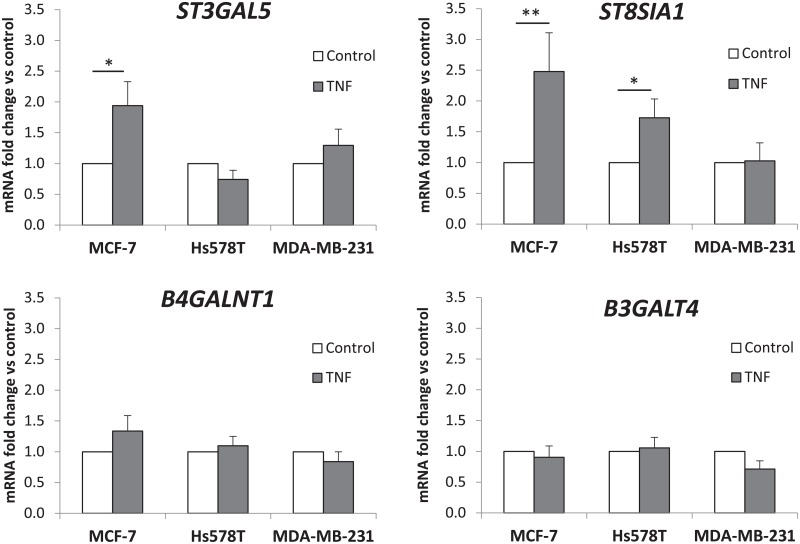
Fig 3. Effect of TNF on GTs expression in MCF-7, Hs578T and MDA-MB-231 cell lines.
Cells were treated with 40 ng/mL TNF for 12-24h. ST3GAL5, ST8SIA1, B4GALNT1 and B3GALT4 mRNA expression was determined by qPCR. Results were normalized to the expression of HPRT and reported to the expression of GTs in non-treated cells (control). Each bar represents the mean +/- S.E.M. of n ≥ 3 experiments. *: p < 0.05, **: p < 0.01 vs. untreated (control).

