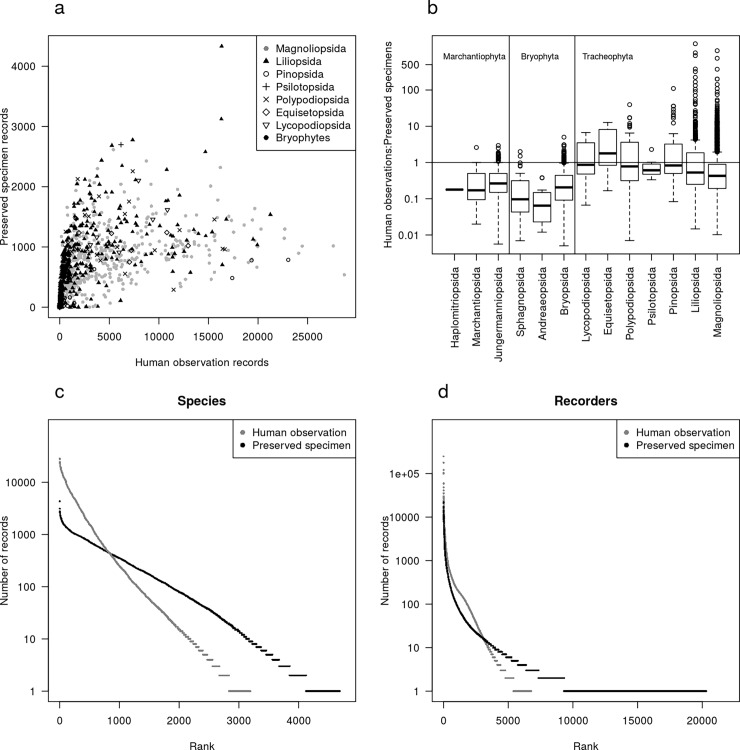
Fig 2.
(a) Number of human observation and preserved specimen records of each species. Species are plotted with symbols denoting their taxonomic class (Bryophyta and Marchantiophyta grouped as bryophytes). (b) The ratio of number of observations to number of specimen records for each species grouped by taxonomic class. Boxes represent interquartile ranges, with whiskers 1.5 times this range, and points showing species outside the range. The median is shown by a black line. Values above one show species with more observation records than specimen records. Vertical lines divide classes within the three phyla. (c) Species rank-abundance plot for each record type in the Norwegian Embryophyta dataset, showing the number of records (note log10 y-axis) for each species plotted against the species’ rank when ordered from most to least abundant within each record type. Table 2 gives the identity of the 10 most abundant species per record basis. (d) Recorder rank-abundance plot for each record type showing the log number of records made by each recorder, plotted against the recorders’ rank when ordered from the most to least abundant within each record type. S1 Table gives the identity of the 10 most abundant recorders per record basis.

