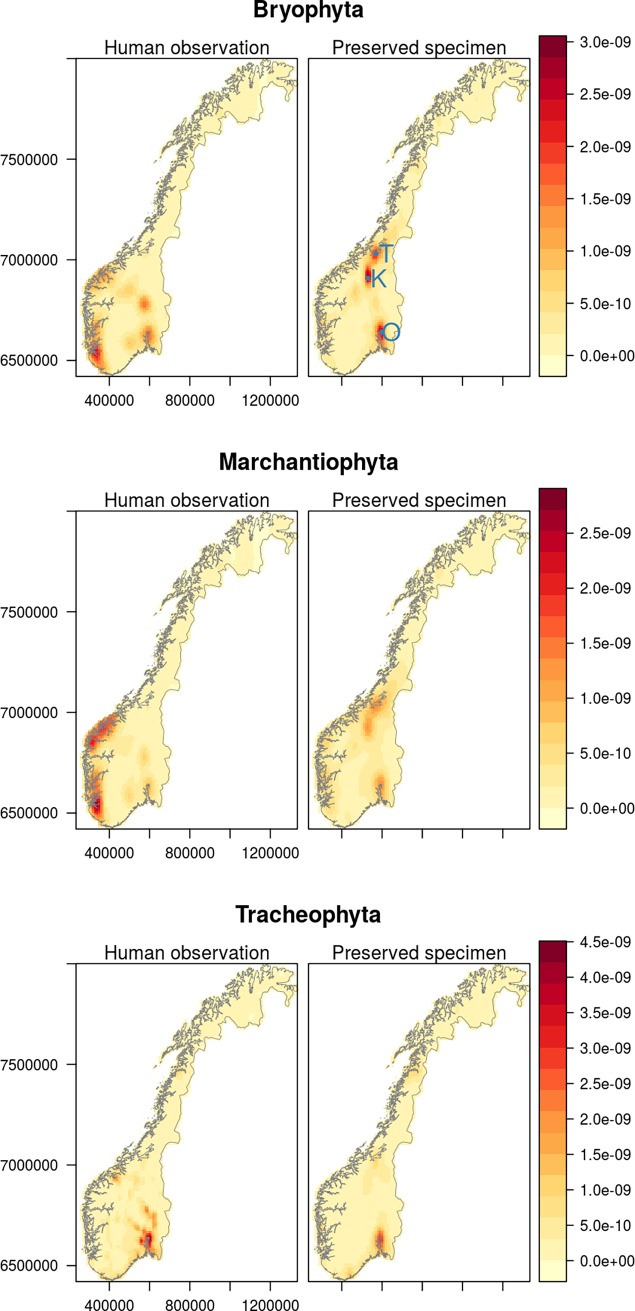
Fig 4. Two dimensional kernel densities showing the probability distribution function (expressed as a percentage) of species occurrences within phyla and record types.
Darker shades denote a higher probability of a given occurrence being at that location. Note that the colour scales differ between phyla, but are the same within phyla. Locations referred to in the text are labelled in top right panel; Trondheim (T), Kongsvoll (K) and Oslo (O).

