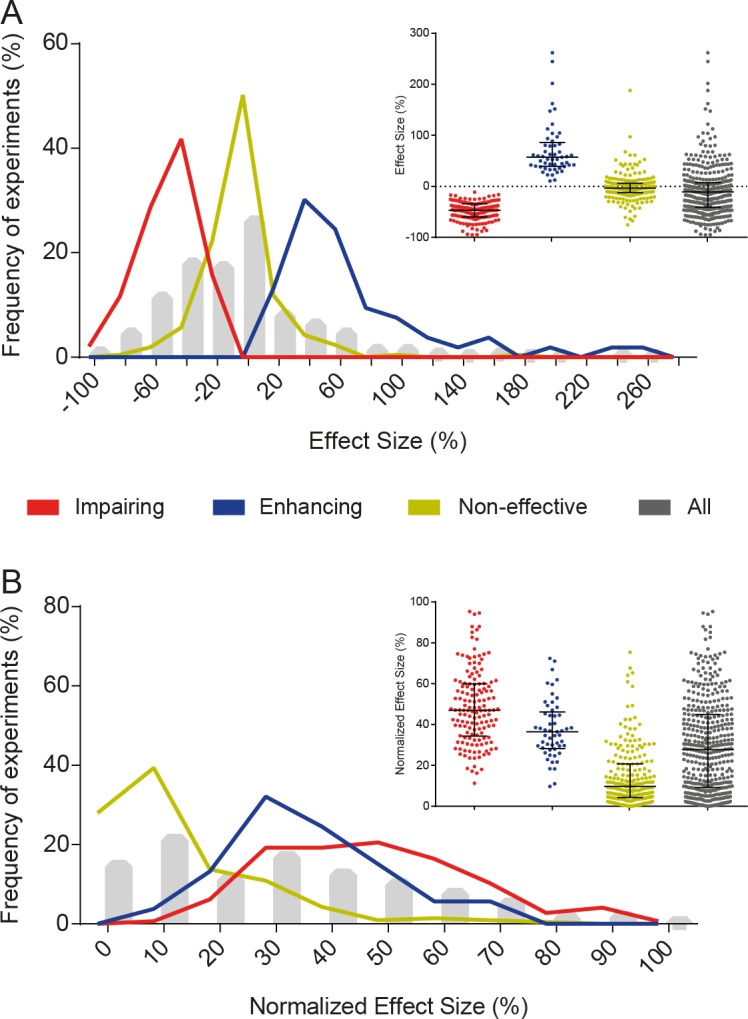
Fig 2. Distribution of effect sizes.

(A) Distribution of effect sizes, calculated as % of control group freezing. Interventions were divided into memory-impairing (-48.6 ± 18.1%, n = 146), memory-enhancing (71.6 ± 53.2%, n = 53) or non-effective (-1.8 ± 26.2%, n = 211) for visualization purposes, according to the statistical significance of the comparison performed in the article. Additionally, the whole sample of experiments is shown in grey (-9.0 ± 47.5% [-13.6 to -4.4], n = 410). Values are expressed as mean ± SD [95% confidence interval]. Lines and whiskers in the inset express median and interquartile interval. (B) Distribution of normalized effect sizes, calculated as % of the group with the highest mean (i.e. control group for memory-impairing interventions, or treated group for memory-enhancing interventions).
