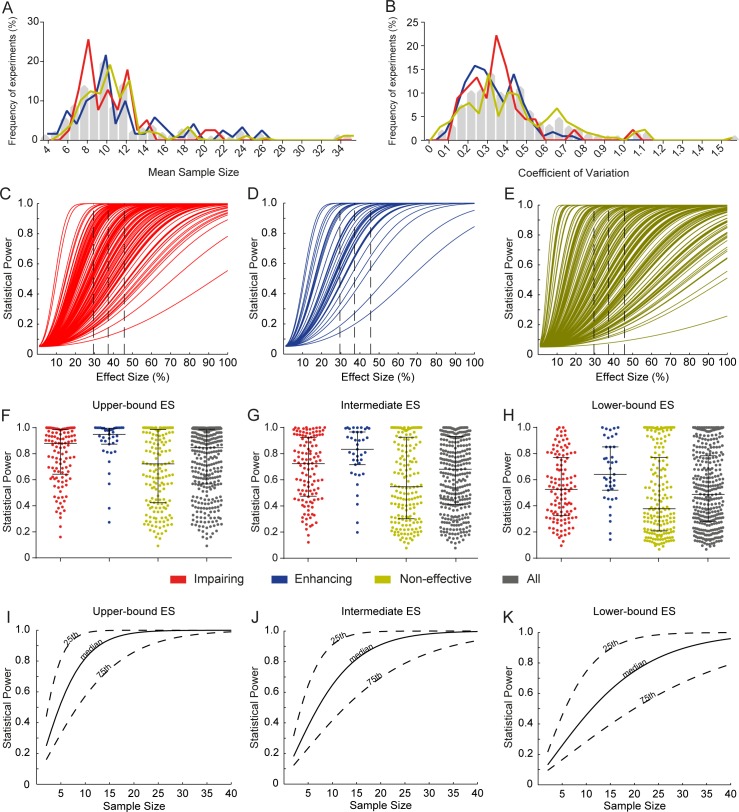
Fig 3. Distribution of sample size, variation and statistical power.
(A) Distribution of mean sample size between groups. Gray bars show the distribution of the whole sample, while colored lines show distributions of impairing (n = 120), enhancing (n = 39) and non-significant (n = 177) experiments separately for visualization purposes. (B) Distribution of coefficients of variation (pooled standard deviation/pooled mean) for each type of experiment. (C) Distribution of statistical power for memory-impairing interventions: based on each experiment’s variance and sample size, power varies according to the difference to be detected for α = 0.05. Dashed lines show the three effect sizes used for point estimates of power in F, G and H. (D) Distribution of statistical power for memory-enhancing interventions. (E) Distribution of statistical power for non-effective interventions. (F) Distribution of statistical power to detect the upper-bound effect size of 45.6% (right dashed line on C, D and E) for impairing (red), enhancing (blue), non-significant (yellow) and all (grey) experiments. Lines and whiskers express median and interquartile interval. (G) Distribution of statistical power to detect the intermediate effect size of 37.2% (middle dashed line on C, D and E). (H) Distribution of statistical power to detect the lower-bound effect size of 29.5% (left dashed line on C, D and E). (I) Sample size vs. statistical power to detect the upper-bound effect size of 45.6%. Continuous lines use the 50th percentile of coefficients of variation for calculations, while dotted lines use the 25th and 75th percentiles. (J) Sample size vs. statistical power to detect the intermediate effect size of 37.2%. (K) Sample size vs. statistical power to detect the lower-bound effect size of 29.5%.

