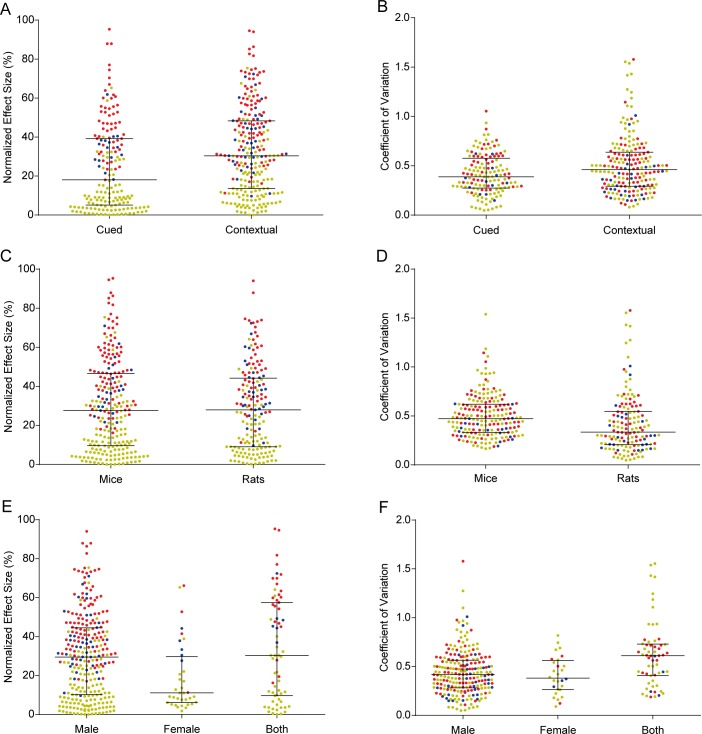
Fig 5. Effect sizes and coefficients of variation across different protocols, species and sexes.
Colors indicate memory-enhancing (red), memory-impairing (blue) or non-effective (yellow) experiments, all of which are pooled for analysis. Lines and whiskers express median and interquartile interval. (A) Distribution of effect sizes across cued (n = 171) and contextual (n = 239) conditioning protocols. Student’s t test, p<0.0001*. (B) Coefficients of variation across cued (n = 145) and contextual (n = 191) conditioning protocols. Student’s t test, p = 0.001*. (C) Distribution of effect sizes across experiments using mice (n = 237) or rats (n = 173). Student’s t test, p = 0.76. (D) Coefficients of variation across experiments using mice (n = 193) or rats (n = 143). Student’s t test, p = 0.008. (E) Distribution of effect sizes across experiments using male (n = 277), female (n = 36) or both (n = 67) sexes. One-way ANOVA, p = 0.004*; Tukey’s post-hoc test, male vs. female p = 0.01, male vs. both p = 0.40, female vs. both p = 0.003. 30 experiments were excluded from this analysis for not stating the sex of animals. (F) Coefficients of variation across experiments using male (n = 233), female (n = 28) or both (n = 60) sexes. One-way ANOVA, p<0.0001*; Tukey’s test, male vs. female p = 0.85, male vs. both p<0.0001, female vs. both p = 0.0006. For coefficient of variation analyses, 74 experiments were excluded due to lack of information on sample size for individual groups. Asterisks indicate significant results according to Holm-Sidak correction for 14 experiment-level comparisons.

