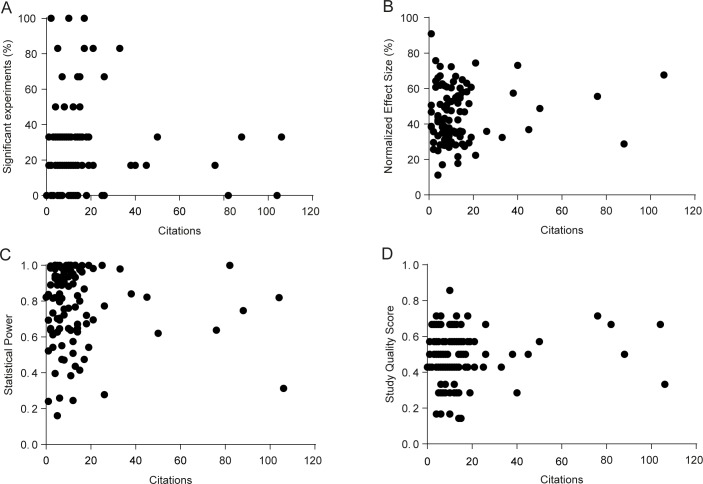
Fig 7. Correlation between citations and percentage of significant experiments, effect size and statistical power.
Citations were obtained for all articles on August 26th, 2016. (A) Correlation between % of significant results per article and citations. r = -0.03, p = 0.75 (n = 121). (B) Correlation between mean normalized effect size of effective interventions and citations. r = 0.097, p = 0.34 (n = 98). (C) Correlation between mean statistical power (upper-bound estimate) and citations. r = -0.08, p = 0.40 (n = 104). (D) Correlation between study quality score and citations. r = 0.09, p = 0.31 (n = 121). According to Holm-Sidak correction for 8 article-level correlations, none is significant.

