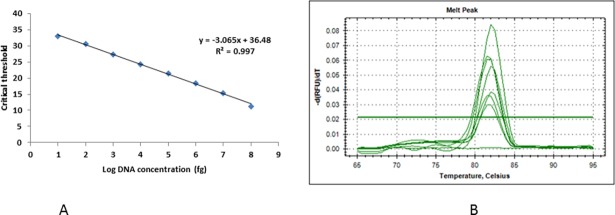
Fig 4. Real time PCR analysis.
(A) Standard curve showing the log10 DNA amount (fg) plotted against cycle threshold (Ct) for different dilutions of genomic DNA of P. triticina (pathotype 77–5) in PCR grade water. (B) Melting curve obtained through real time PCR products using P. triticina specific primers, no peak was observed in negative control.

