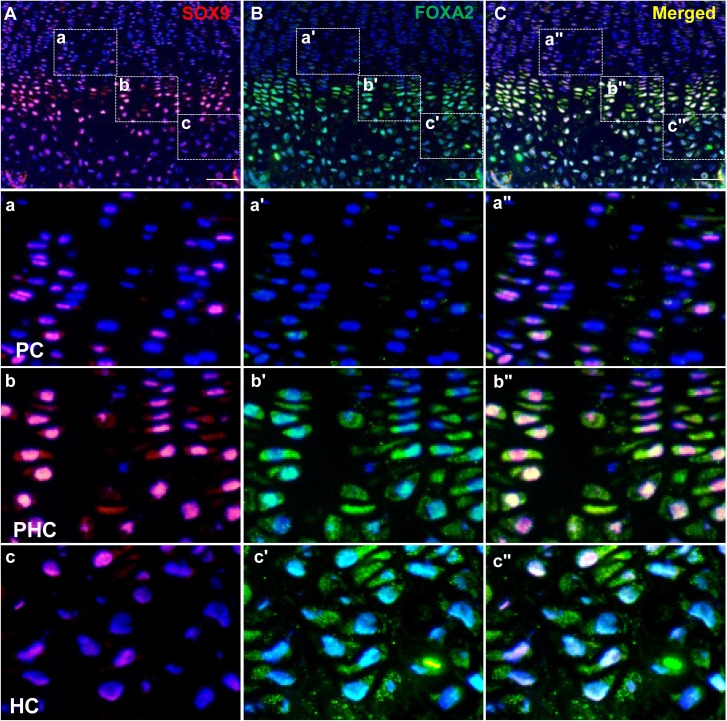
Fig 6. Co-localization of SOX9 and FOXA2 in the growth plate.
(A-C) In vivo expression patterns of SOX9 (A, red), FOXA2 (B, green) and co-localization (C) were shown on the cryosectioned growth plate (P10). Boxed regions of PCs (a-a"), PHCs (b-b") and HCs (c-c") were shown in higher magnification to demonstrate the differential expression and co-localization of SOX9 and FOXA2. (Bar = 100μm).

