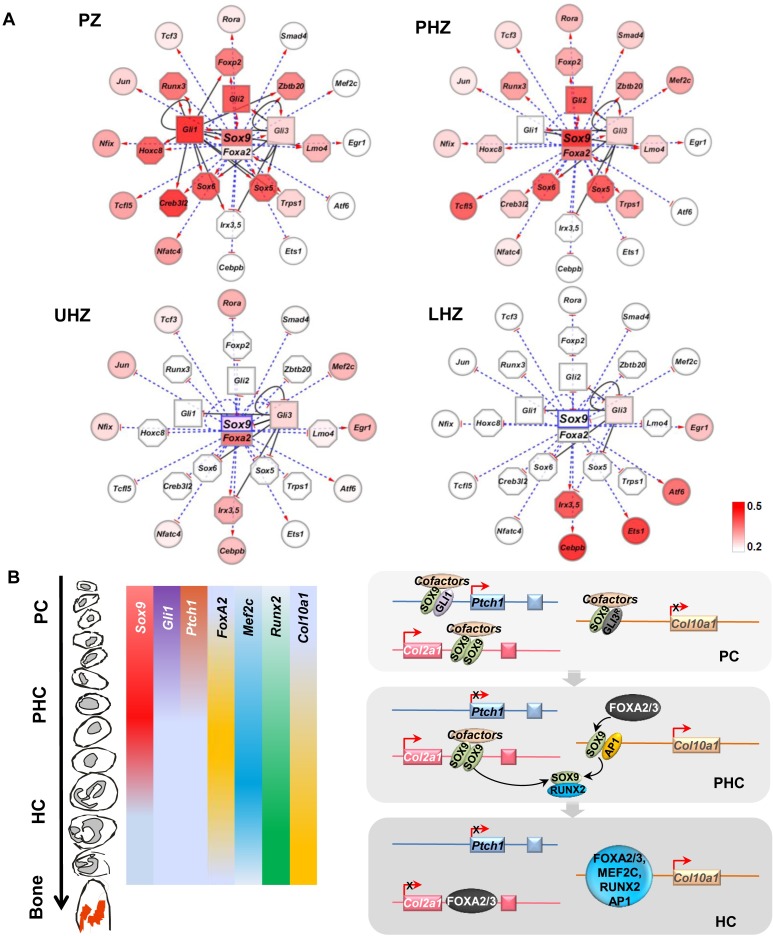
Fig 8. Model of the growth plate GRN directing chondrocyte differentiation.
(A) Stage-specific gene transcriptional programs regulating chondrocyte proliferation (PZ), pre-hypertrophy (PHZ), early hypertrophy (UHZ) and terminal differentiation (LHZ). Each node represents a transcription factor gene or its protein product. All the genes in the network are SOX9 targets identified from the ChIP-sequencing experiment. Each solid line represents an identified GLI-target gene relationship, pointing from GLI1/GLI3 to the target. The TF genes that were targeted both by SOX9 and GLI1/GLI3 are in the inner circle of the network, while those targeted only by SOX9 were placed in the outer circle. The dotted blue line indicates the presence of the predicted evolutionarily conserved SOX9/FOXA2 binding consensus in the target genes. The changes of color codes in the gene nodes from dark to light red and white indicate the dynamics of gene expression levels during the chondrocyte state transition (red representing high expression level; white, low expression). (B) Schematic model of a SOX9-GLI-FOXA phasic GRN coordinating chondrocyte differentiation and transitions in the growth plate.

