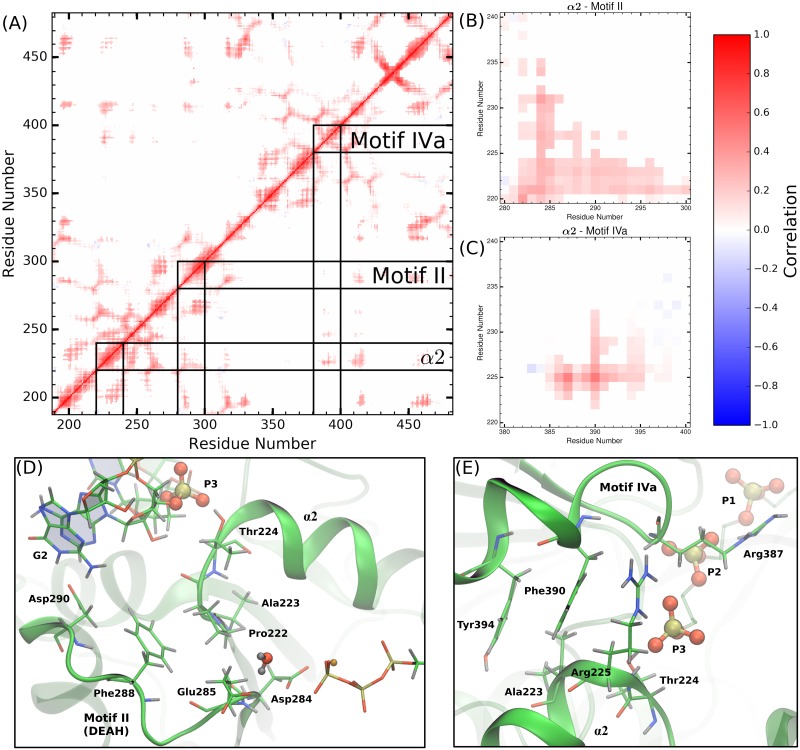
Fig 8. Correlated motions of protein motifs observed to experience RNA- or NTPase substrate-induced allostery.
(A) The average COM-COM residue pair correlation heat map for the ssRNA+ATP system abridged with a distance cutoff of 15 Å. Lines drawn highlight the structural motifs discussed in the previous two sections (α2, motifs II and IVa). Panels (B) and (C) are magnifications of off-diagonal regions in (A) that correspond to the correlations between α2 and motif II or motif IVa, respectively. Hotspots within these regions identify the short-range residue-residue interactions that couple the structures. Panels (D) and (E) provide structural depiction of these residue-residue interactions.

