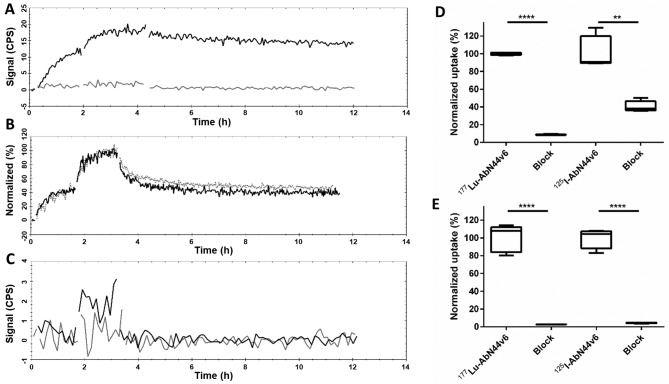
Figure 1.
Representative LigandTracer measurements of (A) 177Lu-AbN44v6 on HCT116 cells (black line) and UM-SCC-74B cells (gray line) plotted as counts per second (CPS). (B) 131I-AbN44v6 (black) and 125I-AbN44v6 (gray-dashed line) on the HCT116 cells, normalized to the percentage of maximum binding. (C) 131I-rituximab on HCT116 (black line) and UM-SCC-74B cells (gray line). In vitro specificity of radiolabeled AbN44v6 normalized to the total uptake of unblocked samples samples for each radioconjugate of (D) UM-SCC-74B, and (E) HCT116 cells, after 24 h of incubation with radioconjugate. Please note that the y-axes in (D and E) are normalized to percentage of uptake of unblocked samples for each radioconjugate; n=5, **p<0.01 and ****p<0.0001.

