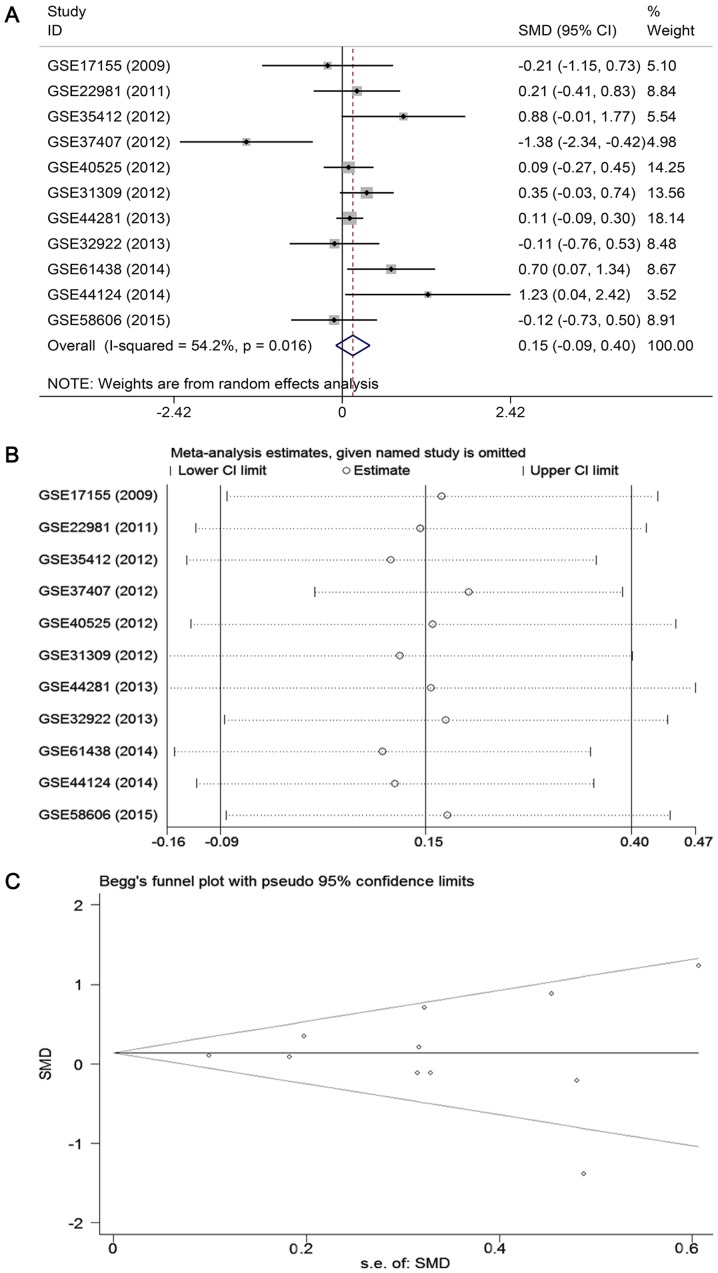
Figure 5.
Expression level of miR-671-3p in BC based on data obtained from the GEO and ArrayExpress databases. (A) Forest plot of the 11 datasets evaluating miR-671-3p expression in BC (random-effects model). SMD <0 indicates that miR-671-3p is downregulated in BC. (B) Sensitivity analysis evaluating the stability of the meta-analysis. (C) Funnel plot assessing the publication bias in the 11 datasets. miR, microRNA; BC, breast cancer; GEO, Gene Expression Omnibus; SMD, standard mean difference; 95% CI, 95% confidence interval; s.e., standard error.

