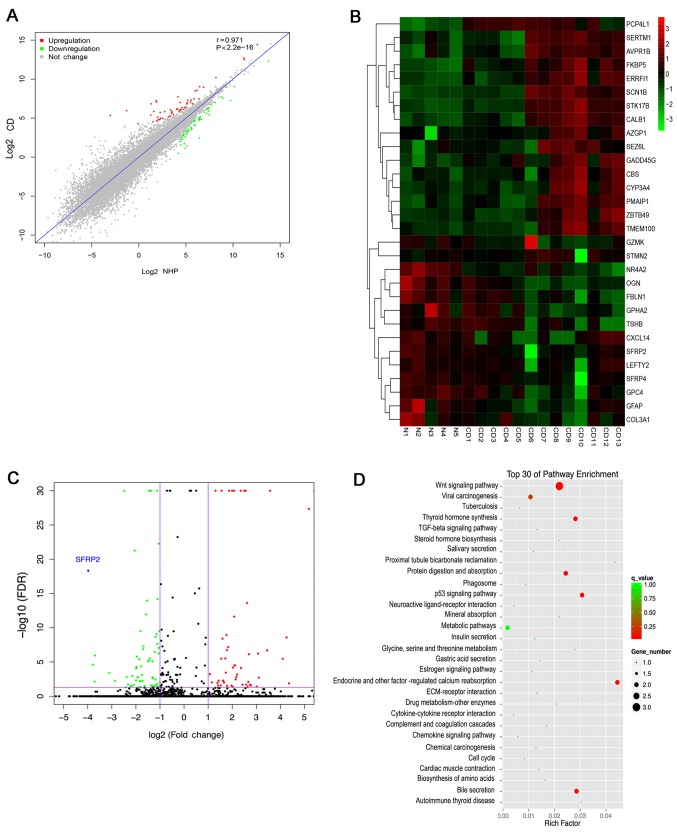
Figure 1.
Transcriptome profile analysis between CD tumor and NHP samples. (A) Heat-map and hierarchical clustering analysis of differentially expressed mRNAs. Rows and columns represent each mRNA and tissue sample, respectively. The relative gene expression is depicted according to the color scale. Red and green indicate upregulation and downregulation, respectively. (B) Expression analysis of CD and NHP. Spearman's correlation coefficient r=0.97. (C) Volcano plot of DEGs. The red and green points represent the up and downregulated genes, respectively. The most downregulated gene SFRP2 is indicated. (D) Kyoto Encyclopedia of Genes and Genomes pathway enrichment analysis of the DEGs. The top 30 pathways are shown, in the Wnt signaling pathway was significantly enriched. DEG, differentially expressed gene; CD, Cushing's disease; NHP, normal human pituitary; SFRP2, secreted frizzled-related protein 2.

