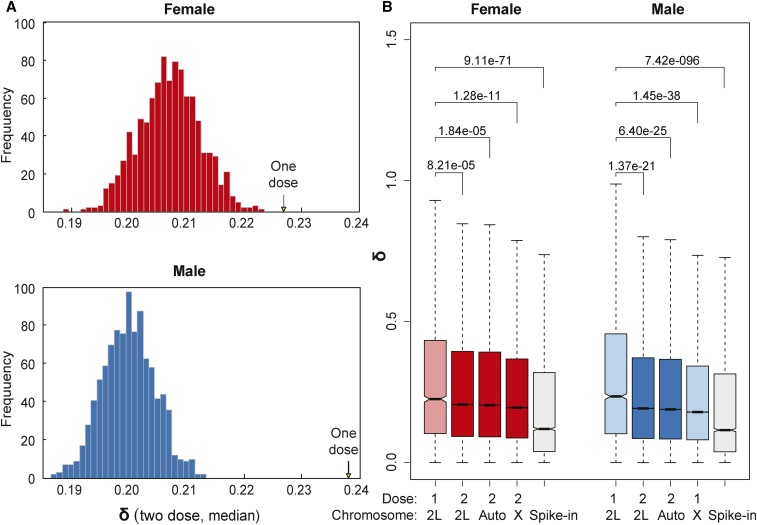
Figure 2.
Expression variation of one-dose genes. (A) The median of δ values for all autosomal one-dose genes (arrows) pooled separately from female (above) and male (below) samples is compared with the distribution of median of δ values for the same genes when they are two dose (histogram). (B) Boxplots show the distribution of δ values for one- and two-dose genes on chromosome arm 2L, other autosomal arms, and the X chromosome for each sex, as well as for the spike-in controls from the External RNA Controls Consortium (Jiang et al. 2011). The plots show medians (bar), 95% confidence intervals (notch), 25 –75 percentiles (box), and 1.5× interquartile ranges (whisker). Outliers are excluded. P values were obtained from Wilcoxon rank sum tests to compare δ values of one-dose genes on 2L vs. two-dose genes on 2L, two-dose genes on other autosomal arms, and genes on the X. The same boxplot design and statistical tests have been used for the rest of the figures in this study. Data from the 99 DrosDel set are used here.

